|
|
|
|
|
|
|
Frequency Doubling Technology (FDT) Perimetry
|
|
WMV video requires Real Player or Windows Media Player (4 MB) Alternate mpg movie (27 MB) |
FDT perimetry is based on a phenomenon described by Kelly6 about 40 years ago, who observed that when an achromatic sinusoidal grating of low spatial frequency undergoes counterphased flickering at a high temporal frequency, the apparent spatial frequency of the grating appears to be doubled. The short movie on the right (double click on the image) shows this effect, in that the frequency of light and dark bars of the stimulus appear to be twice the actual number when the temporal frequency of the counterphased flickering is increased. He reported that this occurred for sinusoidal gratings having a spatial frequency less than approximately 3 cyc/deg undergoing a counterphase flickering at a temporal frequency greater than 7 Hz. It was later suggested that this nonlinear response of the visual system is due the appearance of a second-harmonic distortion that may involve rectification and response compression7, 8. Other investigators have also reported fractional perceived spatial frequency when different temporal frequencies are utilized9-11. |
The FDT procedure first attracted interest as a clinical diagnostic test procedure based on the fact that flicker sensitivity and flicker perimetry has been found to be useful for evaluation of different ocular and neurologic disorders, and can even reveal early losses before they can be determined with conventional clinical test procedures. Because FDT utilizes a high temporal frequency flicker rate, this approach seemed to be potentially appealing, particularly in view of the fact that flicker sensitivity measurements are often resistant to many different artifactual results that may be present. Initial attempts to use FDT as a clinical diagnostic procedure were informative, but also revealed findings suggesting a number of changes that were needed. Many of these changes are outlined in previous publications during the early evaluations of FDT1, 4. Since that time, many other discoveries have also been revealed, as briefly described in this write-up.
Maddess and Henry12 reported that the FD illusion could be useful in detecting glaucomatous field loss. The FDT stimulus predominately stimulates the magnocellular ganglion cell pathway, which is primarily involved in motion detection and flicker detection. Some believe that the neurophysiological substrate for the frequency doubling illusion in humans lies in a subgroup of M cells, the proposed My cells, which show nonlinear characteristics to contrast and are thought to be preferentially lost in early glaucoma12. Others question the mere existence of these cells in humans (based on histological and physiological studies) and believe this may be due to a more complicated processing that goes beyond a retinal level13. Irrespective of these different views, the FDT procedure has been shown to be clinically useful. FDT testing has demonstrated high sensitivity and specificity to early glaucomatous defects2, 14, 15. When adapting the FDT test procedure for clinical use for evaluation of glaucoma and other ocular and neurologic disorders, a number of modifications were needed to provide good characterization of localized visual field regions, optimize the threshold estimation procedure, make it robust for routine clinical testing, provide a test that is easy to administer and perform, and many other features. Most of these characteristics have been presented in prior publications1, 4.
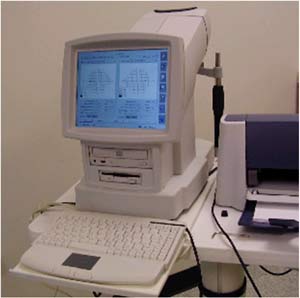
The FDT perimeter1 is a portable, self-contained unit that weighs under 10kg and includes a liquid crystal menu display, a cathode ray tube test monitor, a patient visor, an internal printer, an internal hard drive, and a patient response button. The instrument has a self-calibration procedure. An internal photosensor provides a warning signal when the room illumination is too intense for proper testing.
The instrument should be placed on a height-adjustable table to accommodate for individual patient height. The patient rests his or her forehead on the visor without the assistance of a chin rest, thus tilting the instrument in front or behind by placing a narrow stable object underneath may help maintain a proper and comfortable position. The original FDT does not have a built in internal storage capacity to keep patient data. An external computer running the ViewFinder program can be connected to the instrument to permit storage, retrieval and printout of results.
FDT utilizes a vertical sine wave grating of low spatial frequency (0.25 c/deg) that undergoes counterphase flickering at a high temporal frequency (25 Hz). The contrast of the stimulus is modified for each of the locations (17 or 19) in the visual field (VF). 10º x 10º targets are used, 4 per quadrant within the central 20º, along with one smaller central target (5º diameter circle) projected on the macular region to measure contrast sensitivity.
To avoid temporal transients, the stimulus is presented for a maximum of 720 msec, in which contrast is gradually ramped up to the contrast selected, remains there for a period of time, and then gradually decreases to zero 1. There is a variable interval of time between presentations of up to 500 msec to avoid rhythmic patient response. If the patient response button is pressed from 100 msec to 1 sec after the presentation, the stimulus is recorded as “seen” at that contrast level for that location. If not, the stimulus is recorded as a “non seen” response.
The targets are imaged at optical infinity, thus patients should wear their distance corrected lenses while performing the test (bifocals and progressive are acceptable). The large low spatial frequency targets are not significantly affected by refractive errors up to 6D, so optimal near correction is not needed4.
The patient’s age needs to be entered. Following this, the patient is asked to rest his or her forehead on the visor, is aligned to the display and is given the response button. It is imperative that the patient is able to see all four corners of the screen to ensure proper positioning.
The patient can get familiarized with the test by responding to the sample targets that are projected during the set-up. The patient is instructed to press the response button right after the appearance of the target. Studies have shown that there are no significant differences in contrast detection threshold levels between response to orientation of the FD pattern and yes/no detection of the target16, 17.
During the testing procedure, one of the 17 targets is presented sequentially on a random basis. The patient should also be advised that if the background or vision suddenly appears to be fading, a few eye blinks or eye movements will allow things to reappear as normal 2. This effect, known as the Ganzfeld blankout, is relatively common in perimetric testing that involves steady fixation of a central target and moderately bright uniform background18.
The FDT perimeter offers two types of test patterns, that differ in eccentricity and number of points tested1. The C-20 presentation pattern tests the central 20º with 17 stimulus locations, made up of four 10º targets per quadrant and one circular 5º central one. Two additional points, one presented above and the other below the horizontal midline positioned between 20º and 30º in the nasal field, are incorporated in the in the N-30 test. Because these nasal targets go beyond the width of the FDT screen, the fixation point is moved temporally in order to test these nasal locations. The nasal points are tested when all the other points have been tested, which is done by redirecting the fixation point10 degrees temporally.
 The
FDT can perform two types of testing procedures; screening (supra-threshold)
and threshold, which can use the C-20 or N-30 patterns. Both screening and
threshold protocols compare individual test results to specific age-corrected
contrast sensitivity values found in the instrument normative database19.
It consists of data from more than 700 eyes of 450 subjects with normal vision
between the ages of 18 and 85 and corrects for reductions in sensitivity due to
age and first versus second eye 2.
Test results for VF locations are classified into probability levels based
on age-corrected normative values, depicted on a colored gray scale.
The
FDT can perform two types of testing procedures; screening (supra-threshold)
and threshold, which can use the C-20 or N-30 patterns. Both screening and
threshold protocols compare individual test results to specific age-corrected
contrast sensitivity values found in the instrument normative database19.
It consists of data from more than 700 eyes of 450 subjects with normal vision
between the ages of 18 and 85 and corrects for reductions in sensitivity due to
age and first versus second eye 2.
Test results for VF locations are classified into probability levels based
on age-corrected normative values, depicted on a colored gray scale.
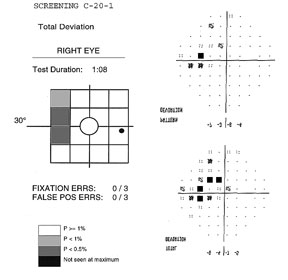
The screening test requires about 45 to 90 seconds to perform (test duration depends on visual field defect severity, reaching a maximum of 135 sec in a blind eye). Two types of screening methods are available, denoted by the suffixes –1 or –5. Each location is tested at different contrast levels for a minimum of 1 to a maximum of 4 times, depending on if the target is seen or not.
The –1 screening test, (example above) presents stimuli at a contrast level that 99% of healthy age-matched subjects would be able to detect. If the stimulus is detected, it is not retested. Unseen targets are retested a second time. If not seen, the target is presented a third time at a contrast level that 99.5% of healthy subjects of that age are expected to see. If detected, the location is labeled as P<1%. If missed, the target is presented a fourth time at maximum contrast (about 100%), and marked as P<0.5% if seen, and “not seen at maximum” if not seen.
The -5 screening test presents targets at a contrast level that 95% of healthy age-matched subjects would be expected to detect. If the target is seen, it is not retested and labeled as normal at P≥5. If unseen, it is retested at the same contrast. If the second target is not seen, it is then presented at contrast level that 98% (or P of 2%) of healthy subjects are expected to see. It is labeled as P<5 if seen, and retested one last time at a higher contrast level at P of 1% (expected to be seen by 99% of healthy subjects) if not. Seen locations at this point of the testing are given a P<2%, and missed locations are labeled as P<1%.
The difference between the two tests is that the –1 protocol offers higher specificity, tending rarely to misclassify a person with a normal visual field, while the –5 procedure has higher sensitivity at detecting early defects at the expense of lower specificity. The N-30-1 test can be used for screening a large number of subjects in the general public, seeing that the incidence of disease is expected to be low, false positives are preferably kept to a minimum and many visual field defects due to several disorders, including those located in the nasal periphery can be detected with this rapid method. The N-30-5 test, on the other hand, offers greater sensitivity that can be advantageous when there is a greater emphasis on detecting the earliest defects, especially in a clinical setting. In these cases, the probability of detecting subjects with defects is greater and additional clinical data can also be available to help confirm or reject FDT abnormal test results.
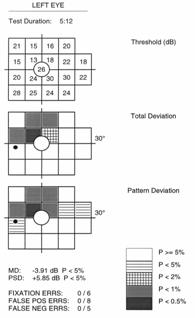
Threshold testing gives comprehensive quantitative information by providing the minimum contrast sensitivity needed to detect the FDT stimulus at each location. Results incorporate a scaling factor to resemble normal sensitivity values found in Humphrey SAP, and are given in decibels (dB) of sensitivity2. Both the N-20 and C-30 testing patterns can be used in the full threshold mode. FDT utilizes a four reversals staircase threshold strategy known as a modified binary search algorithm (MOBS). The test takes about 4 to 5 minutes, depending on the presence and severity of VF defects.
The printout for all FDT results includes the type of testing strategy (screening or threshold) and layout pattern C-20 or N-30) used, located at the top. In addition to patient age, date, time and eye tested, there is a space for patient name and identification number.
 All
screening test results are depicted as a Deviation Plot. The 17 (C-20)
or 19 (N-30) VF contrast sensitivity location results compared to the normative
database are shown on a gray scale plot based on probability levels. Screening
tests preformed with the –1 tests use probability symbols that range from
P≥1% to not seen, while the –5 screening test index ranges from
P≥5% to P<1%
All
screening test results are depicted as a Deviation Plot. The 17 (C-20)
or 19 (N-30) VF contrast sensitivity location results compared to the normative
database are shown on a gray scale plot based on probability levels. Screening
tests preformed with the –1 tests use probability symbols that range from
P≥1% to not seen, while the –5 screening test index ranges from
P≥5% to P<1%
Full threshold test results are graphically represented, similar to the SAP Humphrey Field Analyzer (HFA), with up to three different plots. The Threshold Plot shows the threshold contrast sensitivity (in HFA equivalent dB) at each location. The Total Deviation Probability Plot is found right under the first, showing whether the sensitivity for each VF location falls within normal limits (compared to the age-matched normative database) or whether the sensitivity falls below a probability of 5% to 0.5% of the normal population. This plot is indicative of diffuse or generalized loss in sensitivity.
The Pattern Probability Plot (accessible for ViewFinder software printouts) depicts localized sensitivity loss once the diffuse sensitivity component is removed. The overall height of the average field of vision is moved up or down to match the average normal visual field sensitivity and then differences from this adjusted height are plotted.
An analysis of the differences between the Total Deviation (TDP) and Pattern Deviation (PDP) Probability Plots and the defect pattern formed can give useful information about the type of VF defects present1. Strictly diffuse loss due to a cataract for example, can give a highly shaded TDP with a normal PDP. Typical localized or focal loss (i.e. scotoma) will show both plots shaded at the same locations. If the TDP has more shaded locations than the PDP, the defect probably has both a diffuse and localized component (i.e. glaucoma). In cases that show a TDP that is normal or better than a PDP, the reliability of the test should be questioned because these results can be seen in “trigger happy” subjects or those with an overall field sensitivity greater than normal (that may have early localized defects).
FDT provides two global indices to generally summarize the visual field results for threshold tests, similar to HFA white-on-white perimetry1. Mean Deviation (MD) represents the average sensitivity deviation from a normal healthy person of the same age (based on the normative data base). The MD is an indication of the overall VF sensitivity, and can either be a negative or positive value depending on if the individual’s general contrast sensitivity is below or above the average for that same age group. MD values that fall below 5%, 2% 1% or 0.5 % normal probability levels are indicated with the appropriate label.
Pattern Standard Deviation (PSD) gives an indication of how each test location, on average, deviates from the age adjusted normative database after it has been adjusted for any general depression or supersensitivity. It represents how evenly the field loss is spread across the VF, thus indicative of localized loss. The PSD can only be equal to or greater than zero. PSD=0 indicates that the individual VF has no deviation from a height adjusted VF profile of a normal person of the same age. The higher the PSD value, the greater the amount of irregularities with steeper slopes in the VF.
Three reliability indices are used to help verify whether or not test results are valid2. Scores are given as a fraction (or percentage), based on the number of times the patient responded incorrectly compared to the number of catch trials preformed. All FDT tests, both screening and full threshold, undergo a certain number of catch trials, depending on the strategy and layout of the test performed.
Fixation Errors give an indication of how well the patient kept fixation on the central target throughout the test. During testing, small (1º) targets at a high contrast (50%) are periodically placed in the expected physiological location of the blind spot (the Heijl-Krakau method). This should not be detected in nearly all individuals when proper fixation is maintained. This may not be the case in individuals in which the position of the optic disc (blind spot) is significantly different from the general population and in younger individuals in which the effect of light scattered on the retina permits the target to be detected at the blind spot.
False Positive Errors are used to check that the patient is responding to seen targets. Blank targets at 0% contrast are periodically tested to check if the patient responds even when no stimulus is presented. Subjects that are anxious or “trigger happy” tend to give high false positive results.
False Negative Errors are evaluated by presenting targets at maximum contrast (100%).
For threshold test, recommended limits for reliability are under 33% for each type of error, similar to SAP 2. Because screening tests are rapid and easy, repeat tests are recommended for any type of error.
Studies have shown that FDT offers good reproducibility when compared to SAP 2, 20, 21. Intertest and intratest variability in healthy patients for FDT has shown to be quite comparable to SAP. With regards to glaucomatous patients, SAP variability seems to increase as defect severity increases, yet FDT remains to show a relatively stable and low variability in VF defects of increasing severity. This result suggests that FDT offers reliable VF testing, especially in individuals with VF defects.
Many studies have shown that FDT, both in the screening and threshold mode, offers high sensitivity and specificity in detecting VF loss in a variety of ocular and neurological disorders (summarized in Anderson and Johnson2). Screening studies have reported sensitivity and specificity to range from about 80 to 100%, depending on the criteria used and subjects screened2. Higher specificity in screening is offered with the C-20-1 test and considering abnormal points at lower probability levels. Sensitivity, on the other hand, is increased by using the N-30-5 test and selecting more stringent criteria for determining glaucomatous fields (i.e. two or more abnormal locations on a repeat test). Screening test results that are suspicious and show defects or any reliability index errors should be repeated.
Threshold sensitivity measures for age and location correlate well with SAP, which is why FDT values have been converted to an HFA equivalent. FDT threshold testing has shown to offer good sensitivity and specificity in the detection of early glaucoma and in distinguishing between mild, moderate, and severe VF loss3, 22, 23. Several studies have reported it to be a good predictor of future SAP glaucomatous defects24, and modestly better at detecting FV loss when compared to SAP and SWAP23. The fact that FDT offers high sensitivity and specificity, coupled with the low test-retest variability makes it a promising tool in evaluating the progression of glaucomatous visual field loss25, even if further studies are needed.
Although FDT was originally designed to detect early glaucomatous loss, other ocular and neurological disorders that cause VF loss can also be detected with FDT. Studies have shown that retinal disorders, such as high-risk drusen and rhegmatogenous retinal detachment, diabetic retinopathy, macular scars and retinal branch occlusions can show VF loss detected with FDT1, 2. Neurological and neuro-ophthalmological disorders can also be detected with FDT, including optic neuritis, hemianopsia, papilledema, and tumors1, 2. Moreover, although the normative database includes subjects as young as 18 years old, studies have looked at screening children with FDT26 and developing normative databases for pediatric use.
Misalignments, due to an improper patient positioning or corrective lens frames, can typically give horizontal inferior VF defects in the TDP and PDP. Proper positioning of the patient’s head on the visor and making sure that all four corners of the screen are seen can resolve this problem on a repeated test.
Ptosis, droopy lids, or prominent facial features can give superior defects in both plots. Surgical tape can be used to raise the lid and brow to overcome this problem on repeated tests.
“Trigger happy” subjects are those tend to push the response button every time, even when no target is seen. This is usually caused by poor collaboration, anxiety or habitual timed responses. The test results can show a normal TDP, yet abnormal regions in the PDP. Threshold values can be as high as 40 to 50 dB, which is definitely above average considering that sensitivity in young individuals is normally about 38 dB and that sensitivity physiologically decreases with age. False positive errors tend to be high. A better explanation of the test instructions and additional trial testing may help with the problem on repeated tests. These subjects should not be confused with subjects having slightly better than normal sensitivity and early localized defects. In this case, well-defined localized losses on the PDP may not seem to correspond to the TDP results. Similar abnormal locations on repeated tests, normal reliability scores and an abnormal PSD can help distinguish between the two different types of cases.
Cataracts can cause a generalized sensitivity loss and reduced visual acuity, which can be reversible after cataract surgery (if no underlying pathological defects are present). Depending on the type, location and entity of cataract lens opacity, most of the TDP locations can be abnormal and do not correspond to a normal looking PDP. Threshold values can be lower than normal and MD can be flagged at P values less than 5%. Biomicroscopy examination of the anterior segment is thus essential at excluding VF loss strictly due to cataract.
The first generation FDT perimeter offers several advantages27. The instrument is compact, relatively inexpensive, and easy to transport. Testing is rapid, ranging from 45 seconds for screening tests, to up to 5 minutes for full threshold strategies and tends to be easy to use for both operators and subjects undergoing VF testing. It has shown to be robust to refractive errors up to 6 D. Numerous studies have shown that it offers a good sensitivity and specificity for the detection of visual field loss in early to severe stages of glaucoma, in both screening and in full threshold modes. Defects detected with FDT seem to correlate well with SAP and other non-conventional techniques, and have shown to be predictors of future SAP defects. VF loss due to other ocular and neurological disorders can also be detected with FDT. VF loss progression and screening children with FDT look promising, although further studies are needed.
Although the original FDT offers excellent clinical performance, it does show some limitations:
![]() 17 or 19 points are tested in the central 30º with large targets.
This means that unlike SAP, topographical representation of the morphology and
extent of the defect is limited, which makes it more difficult to detect subtle
defects and monitor change over time in cases of glaucomatous progression. The
restrictions of such targets are specifically related to the fact that they are
large in size, small in number and have limited testing patterns.
17 or 19 points are tested in the central 30º with large targets.
This means that unlike SAP, topographical representation of the morphology and
extent of the defect is limited, which makes it more difficult to detect subtle
defects and monitor change over time in cases of glaucomatous progression. The
restrictions of such targets are specifically related to the fact that they are
large in size, small in number and have limited testing patterns.
![]() The original FDT lacks a system to monitor fixation throughout
testing, which means that the operator cannot check if the patient is fixating
properly or pause the test to adjust patient alignment during a testing
session, but must wait to the end of the test and rely on the fixation errors
and test results as a general indication of patient collaboration.
The original FDT lacks a system to monitor fixation throughout
testing, which means that the operator cannot check if the patient is fixating
properly or pause the test to adjust patient alignment during a testing
session, but must wait to the end of the test and rely on the fixation errors
and test results as a general indication of patient collaboration.
![]() In order to examine the two nasal points in the N-30 pattern, the
fixation target is moved temporally, which may be confusing or cause improper
fixation in some patients. A bigger screen to examine the nasal targets within
the central 30º without a moving fixation target could make testing easier and
more reliable.
In order to examine the two nasal points in the N-30 pattern, the
fixation target is moved temporally, which may be confusing or cause improper
fixation in some patients. A bigger screen to examine the nasal targets within
the central 30º without a moving fixation target could make testing easier and
more reliable.
![]() FDT does not have a built in hardware system to store patient data.
An external computer with the ViewFinder program is needed. Data storage,
editing, retrieval, printing, statistical analysis and interpretation could be
improved with self-contained hardware.
FDT does not have a built in hardware system to store patient data.
An external computer with the ViewFinder program is needed. Data storage,
editing, retrieval, printing, statistical analysis and interpretation could be
improved with self-contained hardware.
![]() FDT was originally designed to detect glaucomatous damage, however,
it has shown that it can be used to detect VF loss related to other disorders.
Targets that are smaller and greater in number could prove to be more useful in
examining the VF in glaucoma and in numerous other ocular and neurological
disorders.
FDT was originally designed to detect glaucomatous damage, however,
it has shown that it can be used to detect VF loss related to other disorders.
Targets that are smaller and greater in number could prove to be more useful in
examining the VF in glaucoma and in numerous other ocular and neurological
disorders.
 The
Humphrey Matrix was released in April 2005 with the aim of providing
significant enhancements to the diagnostic capabilities. Additional tests
having smaller targets and increased number of tested locations to improve the
spatial resolution of VF defects have been created without greatly effecting
the variability and sensitivity resolution27, 28.
Matrix offers tests with different stimulus presentation patterns, in addition
to the test found in the previous version. Improvements have also been made to
the instrument hardware and software, making it easier, reliable and more
efficient to use.
The
Humphrey Matrix was released in April 2005 with the aim of providing
significant enhancements to the diagnostic capabilities. Additional tests
having smaller targets and increased number of tested locations to improve the
spatial resolution of VF defects have been created without greatly effecting
the variability and sensitivity resolution27, 28.
Matrix offers tests with different stimulus presentation patterns, in addition
to the test found in the previous version. Improvements have also been made to
the instrument hardware and software, making it easier, reliable and more
efficient to use.
 The
10º targets in the original FDT have provided a good sensitivity and
specificity in detecting VF loss, however, small localized defects and subtle
changes could be missed. The example below shows how small defects, like that
resulting from a small branch occlusion, can be missed with large FDT targets,
yet picked up with SAP and smaller FDT targets found in Matrix. This restricted
ability to spatially localize VF defects limits the ability of the original FDT
in detecting subtle defects, monitoring progression and classifying
neuro-ophthalmic disorders.
The
10º targets in the original FDT have provided a good sensitivity and
specificity in detecting VF loss, however, small localized defects and subtle
changes could be missed. The example below shows how small defects, like that
resulting from a small branch occlusion, can be missed with large FDT targets,
yet picked up with SAP and smaller FDT targets found in Matrix. This restricted
ability to spatially localize VF defects limits the ability of the original FDT
in detecting subtle defects, monitoring progression and classifying
neuro-ophthalmic disorders.
One of the first prototypes leading up to Matrix involved using smaller 4º square stimuli spaced 6º apart, with a greater number of tested locations in pattern similar to the 24-2 HFA II pattern29. Studies have shown that this type of testing improves the spatial localization of VF defects, which improves the ability to detect and monitor visual field loss, while maintaining a similar sensitivity resolution, low test-retest variability and an increases dynamic range of sensitivity compared to previous version29, 30. In order to ensure this, the smaller targets have a higher spatial frequency of 0.5 cyc/deg (as opposed to 0.25 cyc/deg in FDT) and a lower temporal frequency of 18Hz (in comparison to 25 Hz).
The Matrix perimeter makes use of targets similar to those in the prototype. Four tests have been added, named according to the VF eccentricity examined: 24-2, 30-2, 10-2 and Macula. The tests differ in pattern presentations, test duration, number of catch trials, VF eccentricity, number and pattern of visual field locations tested and characteristics of the stimulus used (size and temporal frequency). All Matrix tests use a stimulus having a spatial frequency of 0.5 cyc/deg. The 24-2 and 30-2 tests use 5º targets that have a temporal counterphase flickering rate of 18 Hz, whereas the 10-2 and Macula test use 2º targets with a temporal flickering rate of 12 Hz (that give a flicker sensitivity as opposed to FD response). Table 1 below lists the specific characteristics of each of the tests found in the Humphrey Matrix.
SCREENING TESTS
The Humphrey Matrix offers two suprathreshold tests (Tab. 1) for rapid screening that take less than 2 minutes per eye, similar to the ones available on the original FDT perimeter27, 28. The difference with using the Matrix is that moving fixation to examine the 2 nasal points is not required.
The 24-2-5(-1) is the additional screening test found in Matrix. Each test location is assigned one of two probability levels (1% or 5%) similar to the N-30 screening, depending on the test selected. What changes in this test is that 55 smaller targets (5º) are used in a testing pattern based on the 24-2 HFA test, to analyze the central 24º. This screening method may be slightly longer than the N-30 test, but greater spatial information about possible localized defects is given, due to the use of a greater number of smaller targets.
THRESHOLD TESTS
The Humphrey Matrix offers 5 threshold testing methods (Tab. 1) that provide quantitative measurements of the VF function at each location. Results are then compared to a normative database based on over 270 individuals (18 to 85 years of age)28. The Matrix threshold tests all use a test algorithm known as Zippy Estimation of Sequential Thresholds (ZEST), and differ in eccentricity tested, pattern, and target characteristic (size and spatial frequency).
The N-30-F
test is essentially the same 19-point threshold test found on the original FDT.
The only minor differences are that Matrix uses a two-reversal MOBS strategy
(instead of four reversals) for determining threshold, which tends to be a more
efficient and time saving algorithm, and moving fixation is not required.
The 24-2 and
30-2 tests are testing methods in Matrix that use 5º targets to examine
55 and 69 locations respectively. Both use the same HFA II pattern, with most
points being similar (indicated in white in the figure) except for the extra 14
most peripheral locations (shaded gray) within the central 30º tested with the
30-2 test. The test results are quite similar to the HFA II printout, which
include the various graphical representation of results (gray scale, TDP, PDP
and both TD and PD dB plots), VF indices (MD, PSD and GHT), and the three
reliability indices. These testing methods offer a greater spatial and detailed
representation of VF defects by the use of smaller sized and a greater number
of targets compared to the prior FDT. This may prove to be advantageous in
detecting VF defects earlier and that are topographically well defined, which
could be used in diagnosing and monitoring subjects with glaucoma and other ocular
and neurologic disorders.
The 10-2 (44 points) and Macula (16 points) tests examine the central 10º and 5º (shaded gray) respectively with targets 2º in size that are counterphase flickered at a lower rate (12 Hz). These testing methods may be more beneficial in disorders that affect the central and macular VF (like age-related macular degeneration and diabetic retinopathy) or when only a small central island of vision remains (i.e. end-stage glaucoma). Note that the smaller stimulus size and lower flicker rate preclude the appearance of frequency doubling, so the test is essentially a flicker sensitivity procedure.
The Humphrey Matrix uses a threshold determination procedure based on Bayesian statistics known as ZEST28. It is similar to the Swedish Interactive Threshold Algorithm (SITA) found in the HFA. Extensive research based on computer simulation and on glaucomatous test results was done to optimize ZEST, and studies have shown that the advantages offered by this algorithm over other strategies include reduced test time (by about 50%), greater efficiency, lower intra and inter test variability, and similar levels of accuracy31, 32.
Changes have been made to the previous FDT perimeter in the Matrix instrument. This enhanced perimeter is slightly bigger and heavier (30cm x 56cm x 43cm, 14 kg) and includes a separate full keyboard with a track pad and an external printer. The advantageous features offered in Matrix include27, 28:
![]() Video eye monitor
that makes it possible for the operator to check patient alignment, cooperation
and fixation throughout the test. The test can be paused if proper alignment is
lost during the test. A “freeze” option provides the capability of measuring
pupil size before starting the test.
Video eye monitor
that makes it possible for the operator to check patient alignment, cooperation
and fixation throughout the test. The test can be paused if proper alignment is
lost during the test. A “freeze” option provides the capability of measuring
pupil size before starting the test.
![]() Patient display
screen is larger, thus moving fixation in examining the nasal points is not
needed.
Patient display
screen is larger, thus moving fixation in examining the nasal points is not
needed.
![]() Enhanced operator
LCD screen, keyboard and internal software make operating the Matrix (organized
into various screens) very easy to use.
Enhanced operator
LCD screen, keyboard and internal software make operating the Matrix (organized
into various screens) very easy to use.
![]() CD-R/W and floppy
drives provides easy data storage, retrieval, transfer and backup.
CD-R/W and floppy
drives provides easy data storage, retrieval, transfer and backup.
![]() Separate USB
inkjet printer allows for single or serial VF results to be printed on standard
8.5” x 11” paper.
Separate USB
inkjet printer allows for single or serial VF results to be printed on standard
8.5” x 11” paper.
![]() Enhanced
statistical analysis procedures to permit better evaluation and interpretation
of test results.
Enhanced
statistical analysis procedures to permit better evaluation and interpretation
of test results.
 The
Humphrey Matrix has been commercially available since 2005, thus studies
regarding this enhanced FDT perimetry are limited. Preliminary results suggest
that smaller testing with a greater number of smaller targets that with narrower
intervals improves the ability of FDT to determine the spatial extent of VF
defects2, 28, 30, 33. In comparison and consistent to other VF testing methods, Matrix
has shown high levels of discriminatory power in identifying early functional
damage in patients at risk34. The
example presented here shows how the spatial representation of VF defects is
enhanced and correlates well with
SAP
when a greater number of smaller targets are used. Studies have shown
promising results with regards to the accuracy, precision, sensibility,
specificity and variability in using this second generation perimeter in normal
and glaucomatous subject29, 32, 33, 35. Matrix seems to offer significant diagnostic
capabilities in the detection and definition of early VF loss that makes it
ideal for screening, diagnosing, and monitoring progression of VF loss in
glaucoma27, 28.
The
Humphrey Matrix has been commercially available since 2005, thus studies
regarding this enhanced FDT perimetry are limited. Preliminary results suggest
that smaller testing with a greater number of smaller targets that with narrower
intervals improves the ability of FDT to determine the spatial extent of VF
defects2, 28, 30, 33. In comparison and consistent to other VF testing methods, Matrix
has shown high levels of discriminatory power in identifying early functional
damage in patients at risk34. The
example presented here shows how the spatial representation of VF defects is
enhanced and correlates well with
SAP
when a greater number of smaller targets are used. Studies have shown
promising results with regards to the accuracy, precision, sensibility,
specificity and variability in using this second generation perimeter in normal
and glaucomatous subject29, 32, 33, 35. Matrix seems to offer significant diagnostic
capabilities in the detection and definition of early VF loss that makes it
ideal for screening, diagnosing, and monitoring progression of VF loss in
glaucoma27, 28.
 FDT has shown a
good sensitivity and specificity comparable to SAP in the detection of VF loss
due to neuro-ophthalmic disorders, however, the use of larger and fewer targets
in the original FDT entails that defects that respect the vertical meridian may
be missed36.
This limitation has been addressed in the Matrix by changing the size and
pattern of the stimulus. The 30-2 and 24-2 tests use closer spaced 5º square
targets in a grid pattern that brackets the horizontal and vertical meridians27,
thus increasing the diagnostic capabilities in detecting typical neurologic
defects that respect the vertical and/or horizontal midlines (i.e. altitudinal
defects, hemianopias, quadrantanopia, etc.) as shown above. Although further
studies are needed, Matrix may prove to play a significant role in detecting VF
loss due to neuro-ophthalmic disorders like non-arteritic ischaemic optic
neuropathy37
and other optic neuropathies36.
FDT has shown a
good sensitivity and specificity comparable to SAP in the detection of VF loss
due to neuro-ophthalmic disorders, however, the use of larger and fewer targets
in the original FDT entails that defects that respect the vertical meridian may
be missed36.
This limitation has been addressed in the Matrix by changing the size and
pattern of the stimulus. The 30-2 and 24-2 tests use closer spaced 5º square
targets in a grid pattern that brackets the horizontal and vertical meridians27,
thus increasing the diagnostic capabilities in detecting typical neurologic
defects that respect the vertical and/or horizontal midlines (i.e. altitudinal
defects, hemianopias, quadrantanopia, etc.) as shown above. Although further
studies are needed, Matrix may prove to play a significant role in detecting VF
loss due to neuro-ophthalmic disorders like non-arteritic ischaemic optic
neuropathy37
and other optic neuropathies36.
The use of FDT in detecting non-glaucomatous VF loss due to various retinal disorders has been reported with the original FDT2. Studies have shown good correlations between fundus observations and rhegmatogenous retinal detachment, however, sensitivity seems to be limited in the detection of small central defects like age-related macular degeneration and central serous chorioretinopathy due to the target size and pattern38, 39. The 10-2 and Macula threshold tests having smaller targets spaced at closer intervals have been included in Matrix with the aim of providing greater sensitivity for detecting central VF loss produced by numerous disorders.
FDT perimetry is a relatively inexpensive, compact, portable and easy method for VF testing. Numerous studies over the past years have shown that it is able to detect VF loss due to glaucoma and other ocular and neurologic disorders with high sensitivity and specificity. Limitations of the first FDT have been successfully addressed in the second generation instrument. The Humphrey Matrix seems to provide enhanced diagnostic capabilities that can be useful in clinical ophthalmology, glaucoma, neuro-ophthalmology, population screening and other ophthalmic disorders.
return to Computer Graphics Perimetry and other new stimuli: 1980 and beyond
return to Table of Contents
![]()
![]()
Copyright 2008. Imaging and Perimetry Society
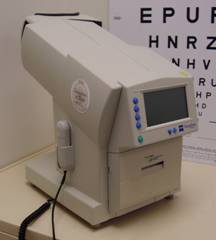 The
Frequency Doubling Technology (FDT) perimeter is a portable, relatively
inexpensive instrument designed for fast and effective detection of visual
field loss1.
This instrument (Welch Allyn, Skaneateles, N.Y., and Carl Zeiss Meditec, Dublin, Calif.) was launched in 1997, and has been used successfully worldwide. Numerous
studies have shown that it offers a high sensitivity and specificity in the
detection of early glaucomatous damage, and in other disorders ranging from
ocular, retinal, neurological and neuro-ophthalmological causes2-5.
FDT offers many advantages in that it is easy to administer and interpret,
liked by most patients, not greatly affected by refractive error and cataract,
has high test-retest reliability, offers rapid screening tests, and has
different full threshold programs.
The
Frequency Doubling Technology (FDT) perimeter is a portable, relatively
inexpensive instrument designed for fast and effective detection of visual
field loss1.
This instrument (Welch Allyn, Skaneateles, N.Y., and Carl Zeiss Meditec, Dublin, Calif.) was launched in 1997, and has been used successfully worldwide. Numerous
studies have shown that it offers a high sensitivity and specificity in the
detection of early glaucomatous damage, and in other disorders ranging from
ocular, retinal, neurological and neuro-ophthalmological causes2-5.
FDT offers many advantages in that it is easy to administer and interpret,
liked by most patients, not greatly affected by refractive error and cataract,
has high test-retest reliability, offers rapid screening tests, and has
different full threshold programs.