|
|
|
|
|
|
|
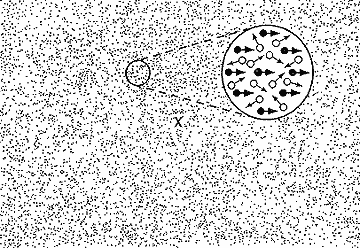
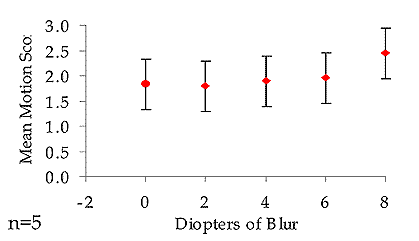
Motion Detection PerimetryMichael Wall, M.D. SummaryMotion detection perimetry is a method that measures a subject's ability to detect a coherent shift in position of dots in a circular area against a background of non-moving dots. Motion size threshold is the smallest detectable circular area in which the subject can detect motion. Subjects respond by touching a computer screen with a light pen where they detect motion stimuli. Their localization errors, as the number of pixels from target center and reaction times are then calculated. Regarding validity of the testing for isolating motion perception, results of a comparison of motion detection thresholds with direction discrimination thresholds and the effects of increasing motion coherence on lowering of motion detection thresholds indicate motion perception is being measured by motion detection perimetry. The retest variability, as the slope of frequency of seeing curves, is low compared with conventional automated perimetry. A "floor" effect, or premature cutoff at the low end of the dynamic range was found while present in version 1 of the software has been eliminated. No significant "ceiling" effect is present. The test runs on a personal computer and is similar in ease of administration to other perimetric tests. Results of a survey of patients taking the test reveals a high participation rate, with above average scores on ease of taking the test and maintaining attentiveness. As with other tests of motion perception, motion detection perimetry is resistant to blur up to six diopters. The sensitivity appears to be superior to conventional automated perimetry but the specificity is not yet known. There are no apparent cultural biases inherent in the test except possibly experience using a personal computer. A database of 100 normals with 20 per decade from age 20-70, is available for interpretation of results. Further studies of sensitivity and specificity are needed to determine whether motion detection perimetry is a viable alternative to conventional automated perimetry. IntroductionOne can make a strong argument that we should be using a motion stimulus to test the visual field. Motion perception is critical for navigating the environment. While the central few degrees of the visual field are important for perception of fine detail and color, the peripheral visual field is optimized for motion perception. In addition, loss of motion perception should correlate better than loss of differential light sensitivity for estimating patients' ability to navigate the environment. In addition, a perimetric method should be chosen that is sensitive to detection of visual field damage. Whether large axons mediating motion perception are lost early in an optic neuropathy such as glaucoma, or isolating a small set of retinal ganglion cell axons like the M-cells that have reduced redundancy theoretically should make for a more sensitive test. Lastly, any new method should have a lower variability then conventional automated perimetry. This is why the "size threshold" method in which the smallest sized stimulus is found at each test location was chosen. This has the effect of producing a constant signal to noise ratio across the visual field. MethodsMotion detection perimetry is performed in a darkened room using an IBM compatible computer. The details of this method have been published.1-3 The test background is composed of 10,000 randomly positioned white dots with 3.26% of pixels illuminated.
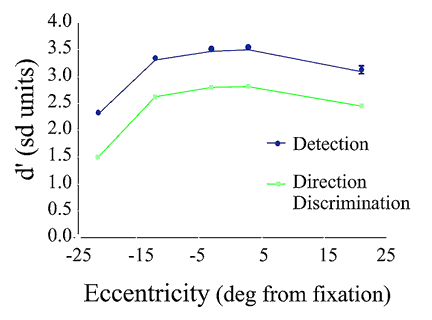
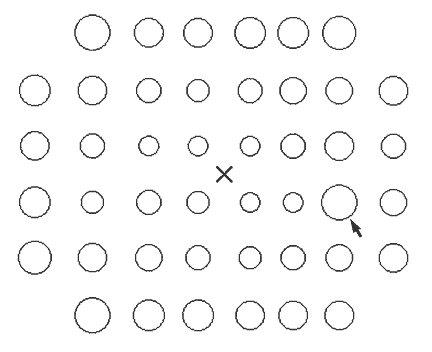
The dots are one pixel in size and 580 asb or 2.75 log units above the background. The dots are positioned randomly on a gray background with a luminance of 50 asb using a 640 × 480 pixel VGA video display. The motion targets are circular random dot cinematograms within which 50% of the dots move centrifugally and 50% move in random directions. The circular target itself is stationary, that is, dots move within the target. Each trial is composed of 10 cinematogram frames displayed in 174 msec. Each dot moves 2 pixels per frame giving a velocity of 11.76 deg/sec. Dots moving out of the circular window are wrapped back to the point 180° from the dot exit position. To increase the dynamic range of the instrument and eliminate a "floor effect", the six smallest targets are "hard coded" using a graded progression of a smaller number of frames, a greater ratio of "on" to "off" pixels and a smaller dot movement step factor. The stimuli are of 17 sizes with a diameter step factor of 10.1 (1.259). The angle subtended by the stimuli ranges from 0.13° to 8.46°. The size of the stimulus varies from trial to trial, and a 2/1 staircase procedure is used to bracket the threshold. The test, therefore, continues until the smallest circle size seen, defined as the size threshold at each test point, is bracketed by the staircase procedure. Stimulus presentation is randomized among the preselected test loci. Fixation is monitored by the visual field technician. For clinical testing, 44 locations are tested; these match the 24-2 Humphrey perimetry test points except absence of the top and bottom rows and the two most eccentric points along the nasal horizontal. Valid responses are defined by having a reaction time greater than 100 msec and less than 1 second and having a localization error of no more than 10° from the center of where the target is presented. Testing takes place in a dimly illuminated room. The testing distance from the screen is fixed at 22 cm by a lens holder attached to the monitor. The monitor is on an adjustable-height table and is positioned so a subject is comfortably seated looking slightly down. The 17-inch diagonal monitor gives a 21° test field (42° by 42° total). A trial is started by the subject holding a light pen to the midpoint of the bottom of the video display while fixing on a central cross. A stimulus is then displayed. If the subject sees the stimulus, he or she lifts the pen signaling the response time. He or she then touches the pen to the position on the video display where the center of the test target is perceived. An FTG Data Systems high resolution light pen model FT-1000 is used. The reaction time is calculated using a high resolution timer function with 1-10 microsecond accuracy.4 The localization error is calculated using the distance from the target center x and y pixel coordinates that is corrected for distortion from monitor screen parallax to the x and y pixel coordinates of where the patient points with the light pen. This error is calculated using the method of least square distance (Pythagorean Theorem). The subject receives feedback of the localization error at the end of each trial. To help maintain attention, if the subject comes within three pixels of the target center, reinforcement is given as a computer-simulated fireworks display. Patients take rest breaks by lifting the light pen off the screen between trials. Test times for normals range from 12 to 20 minutes. The patients' appropriate near correction was used. Care was taken to prevent lens rim artifact by asking if the subject could see white squares on a black background in each corner of the video display while looking at the fixation target. ValidityDoes motion detection perimetry test motion perception or local flicker perception? Ideally, one should choose a property of motion for the subject's response such as direction of motion (direction discrimination). However, since this requires a four alternative forced choice protocol or crossing threshold with a staircase many times and taking the average of the crossings, there is a significant cost in increased testing time. This cost is so high as to be prohibitive for clinical use if the number of test locations used is similar to conventional automated perimetry. Two experiments were performed to better understand the mechanisms involved in detecting random dot stimuli. To test whether the stimuli of motion detection perimetry are processed by motion mechanisms sensitivities to motion detection and direction discrimination were compared in 30 normal subjects and 5 glaucoma patients. A linear relationship between motion perimetry and direction discrimination results was found (figure 2 below).5
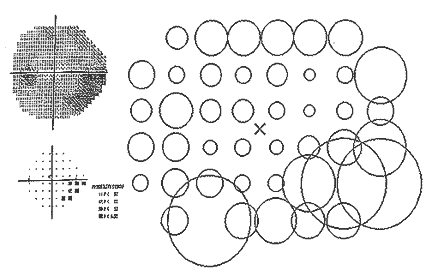
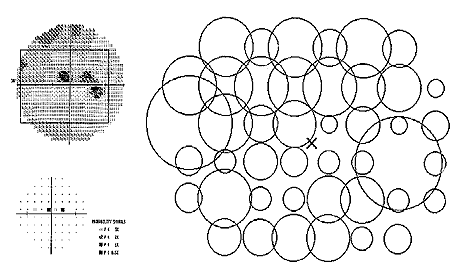
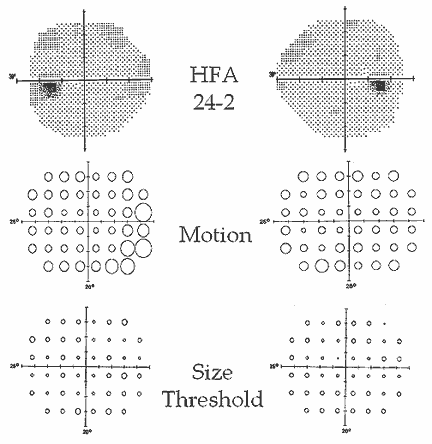
Thirty subjects were tested to determine if with motion detection perimetry subjects were simply responding to flicker rather than random dot motion. Motion signal strength was varied with 0, 50 and 100% motion coherence. It was found that adding motion signal reduced thresholds; therefore, at least some of the response in motion detection perimetry is due to motion signal. From the results of these two experiments, it is likely detection of a moving stimulus rather than local flicker with motion detection perimetry is being tested. Sensitivity and SpecificitySensitivity for defect detection was investigated with subjects having motion detection perimetry and conventional automated perimetry (24-2) done on the same day. 100 normal subjects were used to generate point-wise probability plots, similar to those used for the Humphrey Field Analyzer, and flag whether the tested point in the patients fell outside the upper 95 or 99% confidence bound of the normal subjects. For both tests, to be considered abnormal, three contiguous test points had to be abnormal at a p < .05 level or two contiguous points abnormal, one at the p < .01 level in a clinically suspicious area. The two types of perimetry were compared using these plots for the 44 test loci common to both tests. The details of this analysis has been published.3 Motion detection perimetry appears to be more sensitive in detecting visual loss than conventional automated perimetry in various optic neuropathies including glaucoma and ocular hypertension.3,6 Examples of nerve fiber bundle defects in glaucoma patients found with motion detection perimetry in patients with normal results on conventional automated perimetry can be found in Figures 3-7.3
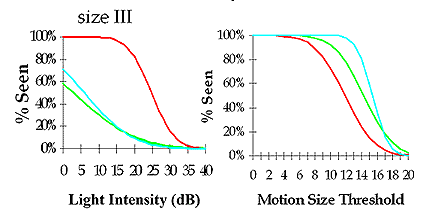
Motion perimetry (Figure 7) shows an inferior nasal nerve fiber bundle defect not present on conventional automated perimetry. In addition, it is not present on luminance size threshold perimetry. This perimetry type is identical to motion perimetry except the background is gray with a lighter gray circular patch that does not move. It is used as a control for the motion perimetry method and shows no deficit. The test's specificity has not yet been determined. Reliability and Test-retest VariabilityVariability was studied by constructing frequency of seeing curves. Psychometric functions were compared from a normal and peripheral test location of normal subjects, normal sensitivity locations of glaucoma subjects, and test locations in glaucoma subjects with 10-20 dB loss on a 24-2 or 30-2 visual field examination. The same protocol was used for motion detection but subjects were tested at every other dB. The results on three subjects show steeper slopes with motion detection perimetry than conventional automated perimetry (Figure 8) signifying lower variability.
Floor and ceiling effectsVersion 1 of the software had a floor effect. This has been remedied. Few subjects are able to detect the smallest stimulus, a single pixel that moves one pixel. A significant "ceiling" effect at the large stimulus end of the dynamic range of motion detection perimetry has not been observed. PracticalityThe hardware costs of the system are an IBM compatible Pentium computer with a PCI bus and at least 8 megabytes of random access memory. A 17" monitor and standard ATI graphics card is used. A custom built lens holder that fits on the top of the monitor along with custom made lenses are necessary. The high resolution light pen can be obtained from FTG data systems. Subject acceptanceA questionnaire was given to 60 consecutive patients and control subjects with an age range of 24-70 years. The results have been reported5 and show the test was well understood by subjects, easy to take and administer and capture subjects' attention. However, the time needed to instruct the older subject to learn the proper response technique was almost twice that for young subjects. The subject participation rate is high; it is uncommon to find subjects that are unable to properly complete the test. Robustness Against ErrorsError can be introduced in any subject's test result by failure to keep the light pen perpendicular to the monitor; this is necessary for light capture by the pen and remains a problem that requires attention by the perimetrist. As with conventional automated perimetry lens rim, eye brow and eye lash artifact can occur. By not testing the top four test locations used by the 24-2 test of conventional automated perimetry the occurrence of this perimetric artifact is less likely. Unlike conventional automated perimetry, motion detection perimetry is robust against errors due to improper refraction. Figure 9 shows little effect of blur up to six diopters. At 8 diopters, mean thresholds rise.
To eliminate guessing errors, it is required that subjects touch the computer monitor within 10° of target center for the trial to be counted as "seen." In addition, outlying thresholds are retested if the value differs by more than 2 stimulus sizes from its neighbors. Normative StandardsData is available on 127 ocular normals using version 2 of the software; this group is broken down into at least 20 subjects per decade from age 20 to 70. Developed by: Michael Wall and James Pujals Commercially available: No Reference List
return to Computer Graphics Perimetry and other new stimuli: 1980 and beyond return to Table of Contents
Copyright 2008. Imaging and Perimetry Society |