The
pioneering work of Stiles provided a means of psychophysically isolating and
measuring the sensitivity of individual color vision mechanisms through the two-color
increment threshold procedure.1,2 Basically, this approach involved
decreasing the sensitivity of some color vision mechanisms (termed
π mechanisms by Stiles) by using a chromatic
adapting background light, and then measuring the sensitivity of another color
vision mechanism by means of a narrow band chromatic stimulus. According to
Stiles’ terminology, π0 refers to the
sensitivity of the rod system, π1, 2
and 3 are short wavelength (“blue”) sensitive mechanisms, π4 is a middle wavelength (“green”) sensitive
mechanism, and π5 is a long wavelength
(“red”) sensitive mechanism. Isolation of π1,
the principal short wavelength (“blue”) sensitive mechanism, was best achieved
with a high luminance (greater than 50 cd/m2) white or broad
spectrum yellow background (530 nm short wavelength “cutoff” filter), and a
large (greater than 2 degrees in diameter) narrow band (440 nm peak wavelength
with a 10-20 nm bandwidth) short wavelength stimulus. The figure below and to
the right shows the spectral sensitivity of three color vision mechanisms (π1,
π4,
and π5) under normal viewing conditions
on the left graph.
The vertical blue line indicates the peak of the short
wavelength mechanism and the vertical yellow line indicates the peak wavelength
of the background. The graph is plotted in a threshold versus wavelength
format, in which the background chromaticity and luminance are constant, the
stimulus wavelength is varied and the stimulus increment threshold is
determined. Note that under these conditions, sensitivity to a short
wavelength stimulus is higher for the middle and long wavelength systems than
for the short wavelength system. The graph to the right shows the same
spectral sensitivity profile in the presence of a bright broadband yellow
background. Here one can observe that there is substantially decreased
sensitivity for the middle and long wavelength mechanisms, thereby permitting
the short wavelength mechanism’s sensitivity to be isolated and measured.
Several
investigators were able to adapt this technique for use in testing patients
with various ocular and neurologic disorders.3,4 Most of this
initial work concentrated on the evaluation of the fovea and possibly a limited
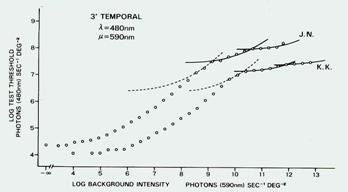
number of extra foveal locations. An example of the results
obtained from these early studies is shown on the top graph presented to the
right. This data representation format is a threshold versus intensity (or
threshold versus radiance) type of representation in which the chromaticity of
the stimulus and background are held constant, the luminance of the background
is varied on successive trials, and the stimulus increment threshold is
determined. As shown by the left portion of the graph (labelled
π4), the increment threshold sensitivity is
unaffected by the luminance of the background, thereby demonstrating a
horizontal line. At some point, the background begins to exert an effect, and
more light must be added to the stimulus to make it detectable, and this
relationship between stimulus and background luminance is linear. When the
background luminance becomes higher, it may significantly adapt one mechanism
(in this instance, π4) and another,
more sensitive, mechanism may then detect the stimulus, as indicated in the
figure where π1 becomes prominent.
Thus, the departures from linearity in the graph are indications that stimulus
detection is being transferred from one mechanism to another, more sensitive
mechanism. A similar threshold versus intensity curve is presented in the
middle graph for an extrafoveal location.4
More
recently, several laboratories have attempted to adapt this procedure for
automated perimetric testing.5-12 In particular, a procedure that
isolates and measures the short wavelength sensitive mechanisms has been of
interest, and it has come to be referred to as Short Wavelength Automated
Perimetry (SWAP).
The lower graph on this page presents threshold versus
sensitivity curves for an eccentric location that was obtained using the
two-color increment threshold technique on a modified automated perimeter.
Initially, it was also determined that there were normal aging effects that
were greater than for standard automated perimetry,5,10 and that
these aging effects were partly due to optical factors12 and some
were due to neural losses.6 Subsequent investigations found that
normal aging effects were essentially equivalent for all visual field
procedures if the dynamic ranges are taken into account.13 It has
also been reported that there are learning effects that occur for SWAP.14,15
Specific details about the SWAP procedure are beyond the scope of this
presentation, and the interested reader is encouraged to review the literature
citations included with this presentation.1-63 The initial methods
for performing SWAP were slightly different among the various laboratories, but
after its clinical effectiveness had been established, many of the laboratories
were able to collaborate and define optimal clinical test conditions for SWAP,
which was extremely beneficial for its application in the eye clinic.16
It was determined that a broadband yellow filter (OG530 Schott filter – a 530
nm short wavelength cutoff filter) for the background, a background luminance
of 100 cd/m, 2 a large stimulus (Goldmann Size V, about 1.7 degrees
diameter) with a narrow band short wavelength interference filter (440 nm peak
transmission, with a 15 nm bandwidth) and a 200 millisecond stimulus duration
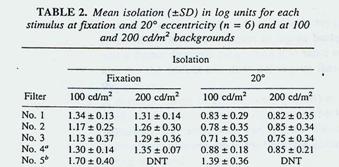
was the most appropriate set of conditions for performing SWAP testing.
The table to the right indicates that under these conditions, the bottom filter
condition (5b) shows that one was able to obtain 1.4 to 1.7 long units of
isolation of the short wavelength sensitive mechanisms (14 to 17 dB), which
subsequent studies have shown makes it possible to maintain
isolation of these mechanisms throughout the entire operating range of the
visual field instrument and for all levels of visual field damage.17-19
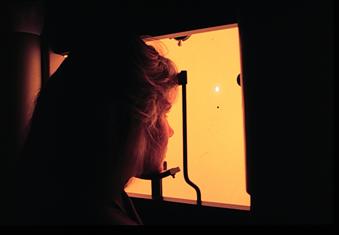
In this Table, DNT refers to “did not test”. The figure to the right presents a
view of the SWAP procedure as performed by an automated perimeter that was
modified to conduct this test procedure. Our best current understanding of the
mechanisms underlying SWAP detection is that it is mediated by input from the
cone photoreceptors through inner retinal interactions and subsequent processing
by a group of retinal ganglion cells that are responsible for coding
blue-yellow opponent color processing.64,65 These ganglion cells
comprise approximately 5% of the total number of ganglion cells and are
believed to project to the intralaminar cells (Koniocellular cells) in the
lateral geniculate nucleus.64,65 In this view the neural mechanisms
underlying SWAP are sparse and are uniquely designed to be specifically
responsive to this type of stimulus display.
As with all
diagnostic test procedures, SWAP has some advantages and disadvantages.
Longitudinal investigations performed at several different laboratories have
demonstrated that SWAP is able to identify glaucomatous visual field deficits
earlier than standard (white-on-white) automated perimetry,8,20-34
revealing deficits in approximately 20-25% of patients at risk of developing
glaucoma who have repeatedly normal visual field results for standard automated
perimetry. The pattern of visual field loss corresponds to those that would be
expected to occur as a consequence of retinal nerve fiber bundle deficits in
glaucoma.7,35 Additionally, the size of SWAP defects are usually
larger than those observed for standard automated perimetry,7,9,36-38
and progression of SWAP deficits is typically greater than for standard
automated perimetry.7,9,36-38 Additional studies have demonstrated
that SWAP deficits can be confirmed by subsequent testing more frequently than
standard automated perimetry losses,24 and that isolation of short
wavelength sensitive mechanisms can be maintained throughout the entire dynamic
range for SWAP testing, even in damaged visual field areas.17-19
Perhaps the greatest advantage of SWAP is that it is able to predict the onset
and location of future glaucomatous visual field deficits for standard
automated perimetry by 3-5 and possibly 10 years.20-34 Two examples
of this predictive value of SWAP are presented below, where SWAP results for
five consecutive years are presented in the bottom panels and standard
automated perimetry results are presented in the top panels. Locations that
are within the 95% normal confidence limits (adjusted for age) are indicated by
gray circles, whereas locations that are worse than the lower normal 5% limit
are indicated by yellow circles, and locations that are worse than the lower 1%
level are denoted by red circles.
-
SWAP
has several disadvantages as well. First, it is more variable than standard
automated perimetry,39 is affected by the absorption properties of
the crystalline lens,12 and is more difficult for some patients to
perform. However, these disadvantages do not deter from the clinical value of
SWAP, and methods have been developed to account for these disadvantages. This
has enhanced the robustness and viability of SWAP as a routine clinical
diagnostic test procedure. Recently, several laboratories have examined the
relationship between SWAP deficits and structural deficits produced by
glaucoma, thereby enhancing our knowledge of the basis for glaucoma
pathophysiology. 40-43
SWAP has also
been useful for diagnostic evaluation of ocular and neurologic diseases other
than glaucoma. SWAP has been found to be useful in the visual field evaluation
of patients with diabetic retinopathy and other retinal diseases,44-53
optic neuropathies, pre-chiasmal, chiasmal and post chiasmal deficits,54-56
migraine,57,58 and other disorders. In most instances, the deficit
noted for SWAP is more extensive than those observed for standard automated
perimetry, or the deficit is present for SWAP but is not evident on standard
automated perimetry. The figure to the right56 demonstrates an
example of standard automated perimetry (top graphs) and SWAP (bottom graphs)
for both eyes of a patient with normal test results (repeatedly) for standard
automated perimetry and a right homonymous hemianopic visual field deficit for
SWAP (repeatedly). Several neuro-ophthalmology exams revealed no remarkable
findings that could account for the hemianopic visual field deficit for SWAP.
However, an MRI scan revealed multiple disseminated plaques that were present
in both hemispheres, but were particularly prominent in the left hemisphere
that would correspond to the right SWAP homonymous hemianopsia.
One of
the shortcomings associated with the commercial version of SWAP is the length
of time required to perform testing. Typically, SWAP testing required 2-3
minutes longer that the Full Threshold procedure for standard automated
perimetry, creating test times of 15-20 minutes per eye. Recently, several
laboratories have applied Bayesian test strategies to the SWAP procedure in
order to provide a more efficient method of testing for clinical diagnostic
purposes.59-62 SITA SWAP has been reported to provide sensitivity
for detection of glaucomatous visual field loss that is highly similar to the
Full Threshold SWAP approach. Also, the variability of SITA SWAP, both within
and between subjects, was found to be equal to or less than that observed for
the standard SWAP procedure.59-62 Additionally, the SITA SWAP
procedure has been reported by two independent laboratories to have 4-5 dB of
increased sensitivity for each test location, when compared to the standard
SWAP procedure.59-62 This has the advantage of increasing the
dynamic range of SWAP, which makes it possible to monitor damaged visual field
areas in a better manner, which is a distinct benefit in view of SWAP’s more
limited response operating range when compared to standard automated perimetry. Some of the factors responsible for this increased dynamic range
for SITA SWAP have been identified, while other remain to be determined.63
The figure to the right shows an example of SITA SWAP for the right eye of a
patient with glaucomatous visual field loss. A superior partial arcuate deficit
is detected within a test duration interval of approximately 4 minutes and 9
seconds.
SWAP is
currently implemented on several commercially available automated perimeters
(along with a normative database and statistical analysis package), include the
Humphrey Field Analyzer II (Model 700 and higher) and Octopus perimeters. In
view of the available literature devoted to SWAP, it would also be a rather
straightforward procedure for many other manufacturers to provide SWAP as a
test procedure as well.
In summary,
SWAP has been a technique that has taken many years to develop and refine, has
had several laboratories conducting longitudinal evaluations of its clinical
capabilities, and continues to be refined. It therefore serves as a good
example of the type of work necessary to validate a clinical diagnostic test
procedure.
References[1-12]
Stiles WS, Color vision: the approach through increment threshold
sensitivity. Proc Nat Acad Sci, 1959, 45: 100-114.
Enoch JM, The two color threshold technique of Stiles and derived component
color mechanisms. In Handbook of Sensory Physiology VII/4 - Visual
Psychophysics (Jameson and Hurvich, eds), Chapter 21, Berlin: Springer-Varlag,
537-567.
Kranda
K, King-Smith PE, What can colour thresholds tell us about the nature of the
underlying detection mechanisms? Ophthalmic Physiol Opt, 1984, 4:
83-87.
Kitahara K, Tamaki R, Noji J, Kandatsu A,
Matsuzaki H, Extrafoveal Stiles p m mechanisms.
Doc Ophthalmol Proc Series: Fifth International Visual Field Symposium, 1983,
The Hague: Junk Pub, 397-403.
Johnson
CA, Adams AJ, Twelker JD, Quigg JM: Age-related changes in the central
visual field for short-wavelength-sensitive pathways. Journal of the
Optical Society of America A, 1988, 5: 2131-2139.
Johnson
CA, Adams AJ, Lewis RA: Evidence for a neural basis of age-related visual
field loss in normal observers. Investigative Ophthalmology and Visual
Science, 1989, 30: 2056-2064.
Adams AJ, Johnson CA, Lewis RA: S cone pathway sensitivity loss in ocular
hypertension and early glaucoma has nerve fiber bundle pattern.
Proceedings of the 10th Symposium of the International Research Group on Colour
Vision Deficiencies, (Drum, Moreland and Serra, eds.), The Netherlands: Kluwer
Academic Publishers, 1991, pp. 535-542.
Johnson,
CA, Adams, AJ, Casson, EJ, Brandt, JD : Blue-on-Yellow perimetry can
predict the development of glaucomatous visual field loss. Archives of
Ophthalmology, 1993, 111: 645-650.
Johnson,
CA, Adams AJ, Casson EJ, Brandt JD : Progression of early glaucomatous
visual field loss for Blue-on-Yellow and standard White-on-White automated
perimetry. Archives of Ophthalmology, 1993, 111: 651-656.
Sample
PA, Weinreb RN, Boynton RM: Acquired dyschromatposia in glaucoma.
Survey of Ophthalmology, 1986, 81: 54-64.
Sample
PA, Weinreb RN: Progressive visual field loss in glaucoma. Investigative
Ophthalmology and Vision Science, 1992, 33: 2068-2071.
Sample
PA, Martinez GA, Weinreb RN: Short wavelength autopated perimetry without
lens density testing. AM J Ophthalmol, 1994, 118: 632-641.
Gardiner
SK, Johnson CA, Spry PGD: Normal age-related sensitivity loss for a variety
of visual functions throughout the visual field. Optom Vis Science, 2006,
83: 438-443.
Rossetti
L, Fogagnolo P, Miglior S, Centofanti M. Vertrugno M, Orzalesi N: Learning
effect of short-wavelength automated perimetry in patients with ocular
hypertension. J Glaucoma, 2006, 15: 399-404.
Wild JM, Kim LS, Pacey IE, Cunliffe IA: Evidence for a learning effect in short
wavelength automated perimetry. Ophthalmology, 2006, 113: 206-215.
Sample
PA, Johnson CA, Haegerstrom-Portnoy G and Adams AJ, Optimum parameters for
short-wavelength automated perimetry. J Glaucoma, 1996, 5: 375-383.
Felius
J and Swanson WH, Effects of cone adaptation on variability in S-cone
increment thresholds. Invest Ophthalmol Vis Sci, 2003, 44: 4140-4146.
Demirel
S and Johnson CA, The influences of stimulus wavelength and eccentricity
on short wavelength pathway isolation in automated perimetry. Ophthalmic
Physiol Opt, 2001, 21: 1-8.
Demirel
S and Johnson CA, Isolation of short-wavelength sensitive mechanisms in
normal and glaucomatous visual field regions. J Glaucoma, 2000, 9: 63-73.
Sit AJ, Medieros FA and Weibren RN, Short-wavelength automated perimetry can
predict glaucomatous standard visual field loss by ten years. Semin
Ophthalmol, 2004, 19: 122-124.
Mansberger
SL, Sample PA, Zangwill LM and Weinreb RN, Achromatic and short-wavelength
automated perimetry in patients with glaucomatous large cups. Arch
Ophthalmol, 1999, 117: 1473-1477.
Johnson
CA, The diagnostic value of Short Wavelength Automated Perimetry (SWAP).
Current Opinion in Ophthalmology, 1996, 7: 54-58.
Demirel,
S. and C.A. Johnson, Short wavelength automated perimetry (SWAP) in
ophthalmic practice. J Am Optom Assoc, 1996. 67:451-456.
Demirel,
S. and C.A. Johnson, Incidence and prevalence of short wavelength automated
perimetry deficits in ocular hypertensive patients. Am J Ophthalmol, 2001. 131:
p. 709-715.
Johnson
CA, Brandt JD, Khong AM and Adams AJ, Short wavelength automated perimetry
(SWAP) in low, medium and high risk ocular hypertensives: Initial baseline
findings. Archives of Ophthalmology, 1995, 113: 70-76.
Casson
EJ, Johnson CA and Shapiro LR, A longitudinal comparison of Temporal
Modulation Perimetry to White-on-White and Blue-on-Yellow Perimetry in ocular
hypertension and early glaucoma. Journal of the Optical Society of America,
1993, 10: 1792-1806.
Sample
PA and Weinreb RN, Color perimetry for assessment of primary open angle
glaucoma. Invest Ophthalmol Vis Sci, 1990, 31: 1869-1875.
Landers,
J., I. Goldberg, and S. Graham, A comparison of short wavelength automated
perimetry with frequency doubling perimetry for the early detection of visual
field loss in ocular hypertension. Clin Experiment Ophthalmol, 2000. 28:
248-252.
Johnson,
C.A., Recent developments in automated perimetry in glaucoma diagnosis and
management. Curr Opin Ophthalmol, 2002. 13(2): p. 77-84.
Sample
PA, Medieros FA, Racette L, Pascual J, Boden C, Zangwill LM, Bowd C and Weinreb
RN, Identifying glaucomatous vision loss with visiual function-specific perimetry
in the diagnostic innovations in glaucoma study. Invest Ophthalmol Vis
Sci, 2006, 47: 3381-3389.
Demirel
S and Johnson CA, Short Wavelength Automated Perimetry (SWAP) in ophthalmic
practice. Journal of the American Optometric Association, 1996, 67:
451-456.
Lewis
RA, Johnson CA and Adams AJ, Automated static visual field testing and
perimetry of short-wavelength-sensitive (SWS) mechanisms in patients with
asymmetric intraocular pressures. Graefe's Arch Clin Exp Ophthalmology,
1993, 231: 274-278.
Racette
L and Sample PA, Short wavelength automated perimetry. Ophthalmol Clin
North Am, 2003, 16: 227-236.
Landers
J, Sharma A, Goldberg I and Graham S, Topography of the frequency doubling
perimetry visual field compared with that of short wavelength and achromatic
automated perimetry visual fields. Br J Ophthalmol, 2006, 90: 70-74.
Landers
JA, Goldberg I, and Graham SL, Detection of early visual field loss in
glaucoma using frequency-doubling perimetry and short-wavelength automated
perimetry. Arch Ophthalmol, 2003, 121- 1705-1710.
Bayer, A.U. and C. Erb, Short wavelength automated perimetry, frequency doubling
technology perimetry, and pattern electroretinography for prediction of
progressive glaucomatous standard visual field defects. Ophthalmology,
2002. 109(5): p. 1009-17.
Soliman,
M.A., et al., Standard achromatic perimetry, short wavelength automated
perimetry, and frequency doubling technology for detection of glaucoma damage.
Ophthalmology, 2002. 109(3): p. 444-54.
Kwon YH, Park HU, Jap A, Ugurlu S, Caprioli J, Test-retest variability of
blue-on-yellow perimetry is greater than white-on-white perimetry in normal
subjects. Am J Ophthalmol, 1998, 126: 29-36.
Johnson,
C.A., et al., Structure and function evaluation (SAFE): I. criteria for
glaucomatous visual field loss using standard automated perimetry (SAP) and
short wavelength automated perimetry (SWAP). Am J Ophthalmol, 2002. 134(2):
p. 177-85.
Johnson
CA, Sample PA, Zangwill LM, Vasile CG, Cioffi GA, Liebmnn JR and Weinreb RN, Structure
and function evaluation (SAFE) II. Comparison of optic disc and visual field
characteristics. Am J Ophthalmol, 2003, 135, 148-154.
Shah NN, Bowd C, Medieros FA, Weinreb RN and Sample PA, Combining structural and
functional testing for detection of glaucoma. Ophthalmology, 2006, 113:
1593-1602.
Sanchez-Galeana
CA, Bowd C, Zangwill LM, Sample PA and Weinreb, RN, Short-wavelength
automated perimetry results are correlated with optical coherence tomography
retinal nerve fiber layer thickness measurements in glaucomatous eyes.
Ophthalmology, 2004, 111: 1866-1872.
Gilmore
ED, Hudson C, Nrusimhadevara RK and Harvey PT, Frequency of seeing
characteristics of the short wavelength sensitive visual pathway in clinically
normal subjects and diabetic patients with focal sensitivity loss. Br J
Ophthalmol, 2005, 89: 1462-1467.
Razeghinejad
MR, Torkaman F and Amini H, Blue-yellow perimetry can be an early detector
of hydroxychloroquine and chloroquine retinopathy. Med Hypotheses, 2005,
65: 629-630.
Jacobson SG, Marmor MF, Kemp CM and Knighton RW, SWS (blue) cone hypersensitivity in
a newly identified retinal degeneration. Invest Ophthalmol Vis Sci, 1990,
31: 827-838.
Sakai
T, Iida K, Tanaka Y, Kohzaki K and Kitahara K, Evaluation of S-cone
sensitivity in reattached macula following macula-off retinal detachment
surgery. Jpn J Ophthalmol, 2005, 49: 301-305.
Han
Y, Adams AJ, Bearse MA, Schneck ME, Multifocal electroretinogram and
short-wavelength automated perimetry measures in diabetic eyes with little or
no retinopathy. Arch Ophthalmol, 2004, 122: 1809-1815.
Afrashi
F, Erakgun T, Kose S, Ardic K and Mentes J, Blue-on-yellow perimetry versus
achromatic perimetry in type I diabetes patients without retinopathy.
Diabetes Res Clin Pract, 2003, 61: 7-11.
Remky
A, Weber A, Hendricks S, Lichtenberg K and Arend O, Shot-wavelength
automated perimetry in patients with diabetes mellitus without macular edema.
Graefes Arch Clin Exp Ophthalmol, 2003, 241: 468-471.
Remky
A, Lichtenberg K, Elsner AE and Arend O, Short-wavelength automated
perimetry in age-related maculopathy. Br J Ophthalmol, 2001, 85:
1432-1436.
Remky
A, Arend O and Hendricks S, Short-wavelength automated perimetry and
capillary density in early diabetic maculopathy. Invest Ophthalmol Vis
Sci, 2000, 41: 274-281.
Hudson
C, Flanagan JG, Turner GS, Chen HC, Young LB and McLeod D, Short-wavelength
sensitive visual field loss in patients with clinically significant diabetic
macular oedemaI. Diabetologia, 1998, 41: 918-928.
Walters JW, Gaume A and Pate L, Short wavelength automated perimetry compared with
standard achromatic perimetry in autosomal dominant optic atrophy. Br J
Ophthalmol, 2006, 90: 1267-1270.
Corallo
G, Cicinelli S, Papadia, M, Bandini F, Uccelli A and Calabria G, Conventional
perimetry, short-wavelength automated perimetry, frequency-doubling technology
and visual evoked potentials in the assessment of patients with multiple
sclerosis. Eur J Ophthalmol, 2005, 15: 730-738.
Keltner
JL and Johnson CA, Short Wavelength Automated Perimetry (SWAP) in
neuro-ophthalmologic disorders. Archives of Ophthalmology, 1995, 113:
475-481.
Yenice
O, Temel A, Incili B and Tuncer N, Short wavelength automated perimetry in
patients with migraine. Grafes Arch Clin Exp Ophthalmol, 2006, 244:
589-595.
McKendrick
AM, Cioffi GA and Johnson CA, Short-wavelength sensitivity deficits in
patients with migraine. Arch Ophthalmol, 2002, 120: 154-161.
Turpin,
A., C.A. Johnson, and P.G.D. Spry, Development of a maximum likelihood
procedure for Short Wavelength Automated Perimetry (SWAP). Perimetry Update
2000/2002, ed. M.a.W. Wall, J.M. in press, The Hague: Kugler.
Bengtsson
B, A new rapid threshold algorithm for short-wavelength automated perimetry.
Invest Ophthalmol Vis Sci, 2003, 44: 455-461.
Bengtsson
B and Heijl A, Normal intersubject threshold variability and normal limits
of the SITA SWAP and full threshold SWAP perimetric programs. Invest
Ophthalmol Vis Sci, 2003, 44: 5029-5034.
Bengtsson
B and Heijl A, Diagnostic sensitivity of fast blue-yellow and standard
automated perimetry in early glaucoma: a comparison between different test
programs. Ophthalmology, 2006, 113: 1092-1097.
Gardiner
SK, Demirel S, Fortune B, Johnson CA and Turpin A, Why are SITA-SWAP
sensitivities higher than those from full threshold SWAP ? Presented at
the XVIIth International Perimetric Society Meeting (Portland, Oregon, July
11-14, 2006.
DaceyDM
and Packer OS, Colour coding in the primate retina: diverse cell types and
cone-specific circuitry. Curr Opin Neurobiol, 2003, 13: 421-427.
Dacey
DM and Lee BB, The “blue-on” opponent pathway in primate retina originates
from a distinct bistratified ganglion cell type. Nature, 1994, 367:
731-735.
 The vertical blue line indicates the peak of the short
wavelength mechanism and the vertical yellow line indicates the peak wavelength
of the background. The graph is plotted in a threshold versus wavelength
format, in which the background chromaticity and luminance are constant, the
stimulus wavelength is varied and the stimulus increment threshold is
determined. Note that under these conditions, sensitivity to a short
wavelength stimulus is higher for the middle and long wavelength systems than
for the short wavelength system. The graph to the right shows the same
spectral sensitivity profile in the presence of a bright broadband yellow
background. Here one can observe that there is substantially decreased
sensitivity for the middle and long wavelength mechanisms, thereby permitting
the short wavelength mechanism’s sensitivity to be isolated and measured.
The vertical blue line indicates the peak of the short
wavelength mechanism and the vertical yellow line indicates the peak wavelength
of the background. The graph is plotted in a threshold versus wavelength
format, in which the background chromaticity and luminance are constant, the
stimulus wavelength is varied and the stimulus increment threshold is
determined. Note that under these conditions, sensitivity to a short
wavelength stimulus is higher for the middle and long wavelength systems than
for the short wavelength system. The graph to the right shows the same
spectral sensitivity profile in the presence of a bright broadband yellow
background. Here one can observe that there is substantially decreased
sensitivity for the middle and long wavelength mechanisms, thereby permitting
the short wavelength mechanism’s sensitivity to be isolated and measured.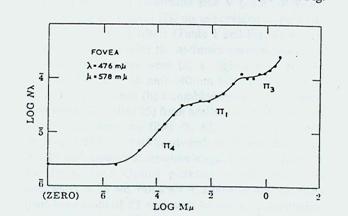
 SWAP
has several disadvantages as well. First, it is more variable than standard
automated perimetry,39 is affected by the absorption properties of
the crystalline lens,12 and is more difficult for some patients to
perform. However, these disadvantages do not deter from the clinical value of
SWAP, and methods have been developed to account for these disadvantages. This
has enhanced the robustness and viability of SWAP as a routine clinical
diagnostic test procedure. Recently, several laboratories have examined the
relationship between SWAP deficits and structural deficits produced by
glaucoma, thereby enhancing our knowledge of the basis for glaucoma
pathophysiology. 40-43
SWAP
has several disadvantages as well. First, it is more variable than standard
automated perimetry,39 is affected by the absorption properties of
the crystalline lens,12 and is more difficult for some patients to
perform. However, these disadvantages do not deter from the clinical value of
SWAP, and methods have been developed to account for these disadvantages. This
has enhanced the robustness and viability of SWAP as a routine clinical
diagnostic test procedure. Recently, several laboratories have examined the
relationship between SWAP deficits and structural deficits produced by
glaucoma, thereby enhancing our knowledge of the basis for glaucoma
pathophysiology. 40-43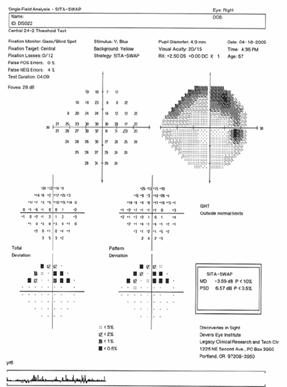 One of
the shortcomings associated with the commercial version of SWAP is the length
of time required to perform testing. Typically, SWAP testing required 2-3
minutes longer that the Full Threshold procedure for standard automated
perimetry, creating test times of 15-20 minutes per eye. Recently, several
laboratories have applied Bayesian test strategies to the SWAP procedure in
order to provide a more efficient method of testing for clinical diagnostic
purposes.59-62 SITA SWAP has been reported to provide sensitivity
for detection of glaucomatous visual field loss that is highly similar to the
Full Threshold SWAP approach. Also, the variability of SITA SWAP, both within
and between subjects, was found to be equal to or less than that observed for
the standard SWAP procedure.59-62 Additionally, the SITA SWAP
procedure has been reported by two independent laboratories to have 4-5 dB of
increased sensitivity for each test location, when compared to the standard
SWAP procedure.59-62 This has the advantage of increasing the
dynamic range of SWAP, which makes it possible to monitor damaged visual field
areas in a better manner, which is a distinct benefit in view of SWAP’s more
limited response operating range when compared to standard automated perimetry. Some of the factors responsible for this increased dynamic range
for SITA SWAP have been identified, while other remain to be determined.63
The figure to the right shows an example of SITA SWAP for the right eye of a
patient with glaucomatous visual field loss. A superior partial arcuate deficit
is detected within a test duration interval of approximately 4 minutes and 9
seconds.
One of
the shortcomings associated with the commercial version of SWAP is the length
of time required to perform testing. Typically, SWAP testing required 2-3
minutes longer that the Full Threshold procedure for standard automated
perimetry, creating test times of 15-20 minutes per eye. Recently, several
laboratories have applied Bayesian test strategies to the SWAP procedure in
order to provide a more efficient method of testing for clinical diagnostic
purposes.59-62 SITA SWAP has been reported to provide sensitivity
for detection of glaucomatous visual field loss that is highly similar to the
Full Threshold SWAP approach. Also, the variability of SITA SWAP, both within
and between subjects, was found to be equal to or less than that observed for
the standard SWAP procedure.59-62 Additionally, the SITA SWAP
procedure has been reported by two independent laboratories to have 4-5 dB of
increased sensitivity for each test location, when compared to the standard
SWAP procedure.59-62 This has the advantage of increasing the
dynamic range of SWAP, which makes it possible to monitor damaged visual field
areas in a better manner, which is a distinct benefit in view of SWAP’s more
limited response operating range when compared to standard automated perimetry. Some of the factors responsible for this increased dynamic range
for SITA SWAP have been identified, while other remain to be determined.63
The figure to the right shows an example of SITA SWAP for the right eye of a
patient with glaucomatous visual field loss. A superior partial arcuate deficit
is detected within a test duration interval of approximately 4 minutes and 9
seconds.