 Methods
Photographic and Angiographic Changes After Brachytherapy for Choroidal Melanoma:
Findings From the Collaborative Ocular Melanoma Study (COMS)
The Collaborative Ocular Melanoma Study Group*
*Prepared by: H. Culver Boldt, MD1, B. Michele Melia, ScM2, Judy Liu, M.D.1, Sandra M. Reynolds3, MA. Lists of members of the COMS Group can be found in references.
1University of Iowa Hospitals and Clinics, Department of Ophthalmology, Iowa City, IA; 2Jaeb Center for Health Research, Tampa, FL; 3Department of Ophthalmology, Johns Hopkins University, Baltimore, MD.
The COMS design has been described previously [COMS Report No 3, 1993].
Patient selection and follow-up
Patients whose eyes are the subject of this study had medium-sized choroidal melanoma at least 2.5 mm but no more than 10.0 mm in height (no more than 8.0 mm in height when the tumor was near the disc), and no more than 16 mm in greatest diameter. Patients who had peripapillary tumors that subtended an angle of 90 degrees or greater, as measured from the center of the optic disc, were ineligible. Detailed information from a patient interview and ophthalmic examination was recorded on standard forms at baseline, every six months for 5 years, and yearly thereafter. This study was conducted with institutional review board approval at all participating institutions. The first patient enrolled in January 1987 and the last in July 1998. A total of 1317 were enrolled; 657 were randomly assigned to I-125 brachytherapy. Of these patients seven (1.1%) declined their assigned treatment and were excluded from this analysis. The remaining 650 patients are the subject of this report.
Patients with the baseline or follow-up diagnosis of systemic conditions including diabetes and hypertension were identified from patient questionnaires.
Treatment Protocol
The size of the radioactive plaque was chosen so that the tumor base and a tumor free margin of 2-3 mm on all borders were completely covered by the plaque. The absorbed dose at the prescription point was 85 Gy delivered at a rate of at least 0.42 Gy/hr, but no more than 1.05 Gy/hr.
Funduscopic and Angiographic Grading Protocol
At baseline and follow-up examinations, fundus photography and fluorescein angiography were performed according to COMS protocol. Photographs and angiograms were sent to the COMS Photograph Reading Center at the University of Iowa Hospitals and Clinics for standard interpretation, and coding of selected features of the eye and tumor. Photographic quality and, at baseline, consistency with the diagnosis of choroidal melanoma were assessed. For this study, photographs and angiograms at baseline, 2 years, 5 years, and 8 years were selected for analysis because fluorescein angiography was required at these times. Thirty selected photographic and angiographic features were graded categorically (either present or absent) and on a severity scale by three graders. “Questionable” responses accounted for 44 (0.1%) of a total of 39,535 coded items. To assess reliability between graders, 5% of graded photographs and angiograms were randomly selected for review. Intergrader reliability ranged from 0.6 to 0.8 for most features.
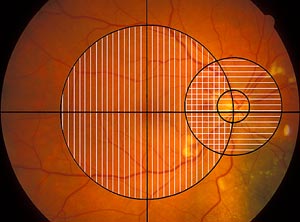
Only the posterior pole photographs were graded for this study. Both color photographs and angiograms were utilized for grading features and were divided into two fields. [Figure 1] The macular field included a circle with a radius that extended from the center of the fovea to the center of the optic disc, but did not include the optic disc itself. The peripapillary field was a 2250 micron radius circle centered on the optic nerve. There was some overlap in the temporal peripapillary region. Gradings included the retina and vitreous overlying the tumor when the tumor was within the macular or peripapillary field.
 |
|
| Figure 1 |
Grading Scheme
Grading was performed for both the peripapillary field and the macular field separately for each feature unless the feature was specific to the macula or optic nerve. “Questionable” responses were permitted. In order to determine the relationship of the retinopathy features to visual acuity, features were also graded as to whether they were within 750 microns of the fovea, or involved the center of the fovea.
Statistical Methods
This analysis was based on data received at the COMS Coordinating Center as of February 9, 2004, the date of final closure of the database from active COMS clinical follow-up. For each of the 30 photographic and angiographic characteristics, frequency distributions of each characteristic at each follow-up time were generated for all patients (N=650), as well as patients with diabetes with or without hypertension (N=65), patients with hypertension without diabetes (N=151), and patients with neither diabetes nor hypertension at baseline (N=431; 3 patients could not be classified as their diabetes and/or hypertension status was unknown). For each follow-up time, we also computed the mean and median number of features that were gradable, and the mean and median number of features that were graded as questionable or greater severity for patients who had at least 1 feature graded as questionable or greater severity. Jonckheere’s test was used to identify trends in median number of features over follow-up time [ref]. To compare prevalence of each feature across follow-up times, we fit a logistic regression model with each feature coded as present or absent, using generalized estimating equations to account for correlation between time points [ref]. Prevalence of adjacent time points was then compared using linear contrasts with p<0.01 considered evidence of a statistically significant difference in prevalence. To compare severity of each feature across follow-up times, we performed an analogous analysis of the severity scores using linear regression. In both types of model, time was treated as a categorical variable so as not to impose any assumptions regarding trends over time. To determine whether diabetes or hypertension affected prevalence and severity of features, we compared the diabetic and hypertensive groups as defined above to patients who had neither diabetes nor hypertension at baseline with respect to prevalence and severity of each feature at each follow-up time using the Fisher’s exact test to compare prevalences and the exact Wilcoxon rank sum test to compare scores, with p<0.0125 considered evidence of a statistically significant difference between groups. Finally, to examine what features typically occurred together and at what times, we performed a cluster analysis for each follow-up time that included all features with the Jaccard coefficient used as the distance measure between each pair of features [ref]. The Jaccard coefficient is defined as the number of patients with both features of a pair coded as present divided by the number of patients with either feature coded as present. All statistical analysis was performed using SAS software, version 8.0 (SAS Institute Inc., Cary, NC).
Design and methods of a clinical trial for a rare condition: the Collaborative Ocular Melanoma Study. COMS Report No. 3. Control Clin Trials. 1993 Oct;14(5):362-91.
back to COMS index