|
|
|
|
|
|
|
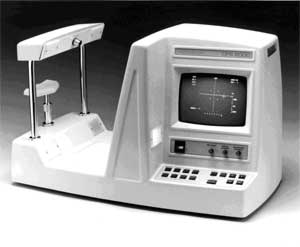
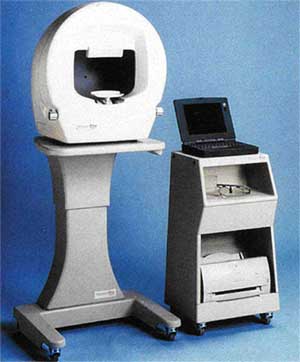
History of the Henson PerimetersBy David Henson Professor David Henson Email: david.henson@manchester.ac.uk Web: http://www.medicine.manchester.ac.uk/staff/davidhenson Henson perimeters, which date back to 1986, have focused on the use of supra-threshold perimetry to provide primary care providers with a compact instrument that can rapidly screen the visual field for functional loss from conditions such as glaucoma. Henson perimeters have been used in a number of epidemiological trials that have investigated the prevalence of glaucoma, including the Beaver Dam study1, the West of Ireland study2 and the North London study3, and in all cases have assisted in the detection of significant amounts of previously undiagnosed disease. Later models (Henson Pro range) have added threshold perimetry and drivers tests to provide a range of instruments that combine rapid screening with an ability to accurately quantify the visual field. The Henson CFS 2000 and CFA 3000The first Henson perimeter was the CFS 2000 (CFS-Central
Field Screener), see figure 1. The CFS 2000 was the first computerised multiple-stimulus
supra-threshold perimeter4, 5. Multiple-stimulus perimetry, which was first
introduced by Harrington and Flocks in 195524 and later developed in
instruments such as the Fincham Sutclffe Screener and
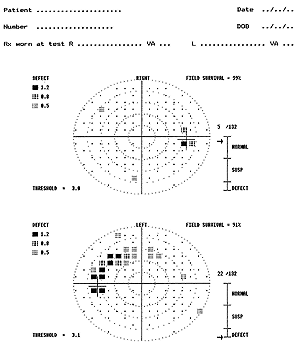
the Friedmann Visual Field Analysers22, had been popular within the The CFS 2000 and the later CFA 3000 (see below) used broad spectral (530-600nm) light emitting diodes (LEDs) as stimuli with a maximum output of 300cd/m2. The LEDs had flat diffusing front surfaces and were embedded in a flat tangent screen (positioned 33 cm from the eye) which was maintained, via an external illuminator and photocell, at 0.25cd/m2. When the LEDs were turned off they had approximately the same reflective properties as the screen and overcame the ‘black hole’ effect that had occurred in earlier LED based perimeters. The stimuli had a presentation time of 200ms and were positioned on a 3 degree square matrix (220 LEDs) out to an eccentricity of 24 degrees. The CFS2000 introduced the concept of graded testing, with 3 different levels of investigation6, 7, 8, 12. The first level tested just 26 retinal locations and was designed to be used on patients in whom there was no suspicion of a field defect, i.e. for screening purposes. The second level increased the number of test locations to 66. It was designed to be used on patients in whom there was some suspicion, either as a result of them missing one or more of the screening stimuli or because of some other parameter such as a raised IOP or suspicious disc appearance. The third level took the number of test stimuli up to 132. This level was designed for accurate spatial mapping of visual field defects. The three levels of investigation were designed to be run one after the other. If at the end of the first level the practitioner became suspicious then the test was extended to the next level. Each new level incorporated all the stimuli in the earlier levels so that they can still be checked and modified after the test has been extended. The CFS2000 also introduced quantification to supra-threshold perimetry10, 11. After each presentation/input the software computed the likelihood of the current result coming from a ‘normal’ patient. This analysis took into account the depth of the defect (the CFS2000 quantified the depth of the defect as being at 5, 8 or 12dB above the estimated threshold), the number of defective locations and whether or not the missed stimuli were clustered13, 14. The results of this analysis were presented to the practitioner in the form of an arrow and a scale, see figure 2. If the arrow points to the defective region of the scale then there was a less than 1 in 1000 chance that the visual field result came from a patient with a normal visual field. Clinical results with the Henson CFS2000 were reported by Henson & Bryson 19879.
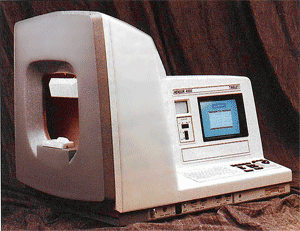
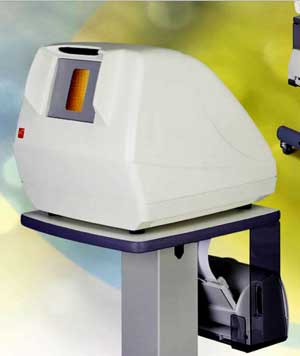
A later version of the CFS 2000, the Henson CFA 3000 (CFA-Central Field Analyser), was introduced in 1988. This version used a slightly more powerful computer and, in addition to the multiple-stimulus supra-threshold test, included a single-stimulus automated threshold test that used the widely adopted 4-2 bracketing strategy23 and a push button response key for the patient. The Henson CFA 4000 and 3200The CFA 4000, which was introduced in 1993, was produced in response to requests from both optometrists and ophthalmologists for an instrument that combined the simple screening operations of the Henson CFS 2000 with the greater range of facilities found in bowl perimeters16. The 4000 (Figure 3) used a 25cm bowl made of diffusing translucent material and LED stimuli. The light from the LEDs was projected onto the back surface of the translucent bowl. This arrangement (which is also used in the Henson Pro range of instrument, see below) ensured that the LEDs are practically invisible to the patient except when turned on. The maximum intensity of the stimuli was increased to l000cd/m2, which gave the 4000 a larger dynamic range of 48dB. The background intensity of the 4000 was set slightly higher than that of the CFA3000, (3.14cd/m2, as opposed to 0.25 cd/m2) allowing the instrument to be used in all but the most extreme room environments The Henson 4000 could test out to an eccentricity of 72°, and included a program that was specifically designed to test the visual field of drivers and to meet the UK Department of Vehicle Licensing Authority regulations. The 4000 was also fitted with a CCD camera which relayed an image of the patient's eye to a dedicated monitor on the operator's console. The test programs of the 4000 used three different strategies: multiple-stimulus supra-threshold, single-stimulus supra-threshold and full-threshold. Within each strategy there was a series of different test programs designed for specific regions of the visual field, for example central, peripheral, and drivers' fields. The 4000 also introduced a new technique for establishing the threshold with multiple-stimulus patterns at the onset of a supra-threshold strategy15, 18. The Henson 4000 was the first computerised perimeter that incorporated a facility to add additional test points to any of the tests at any stage of an examination. This was achieved with a tracker ball incorporated into the operator's console (Figure 2). The tracker ball controlled the position of a cursor on the computer screen. When the cursor was placed within the region of the displayed test chart the test was momentarily suspended. Additional test points could then be added or existing points re-tested by simply placing the cursor over the required location and then pressing one of the tracker ball buttons. In the case of the supra-threshold strategies this resulted in a stimulus being presented at the selected location. In the case of the full-threshold strategy it resulted in the selected location being tested/re-tested once the cursor has been taken out of the area of the field chart (this allows the perimetrist to select several locations before re-starting the test). The tracker ball could also be used to erase an already tested location. In the full-threshold strategy, this allowed the perimetrist to remove any artefacts, such as those due to a spectacle or trial lens rim, which might adversely affect the computed indices (after removal they could be re-tested as described above). Visual field data could be saved and recalled on either the internal hard disk drive or the 3.5-inch floppy drive. Once recalled the perimetrist could choose to re-test certain locations, delete certain locations, add additional test points, recalculate the visual field indices, or start again. The Henson 4000 operated through MSDOS which meant that its files were compatible with most PCs. The more powerful computer supported an on line help facility and improved graphics.
The Henson CFA 320017 was introduced in 1995. Externally it is similar to the CFA 3000, retaining the same testing distance, background luminance, stimulus size and overall dimensions of the CFA 3000. Internally, however, the CFA 3200 is the same as the CFA 4000. It incorporated the tracker ball, described above, for adding/deleting individual stimuli and had facilities for the storage and recall of visual field data. It again had 3 test strategies (multiple-stimulus supra-threshold, single-stimulus supra-threshold and full-threshold) although these were confined to the central 24 degrees. The Henson Pro 3500 and 5000 PerimetersThe Henson Pro 3500 and 5000 were launched in 1997 and 1999. These two instruments signalled the beginning of the Henson Pro range. They are both bowl perimeters (25cm radius) with LED stimuli. Light from the LEDs is projected onto the back surface of the bowl, as in the Henson CFA 4000. The stimuli are arranged on a 3° square matrix within the central 30° of the visual field and a 12° square matrix from 30-72°. The resolution in the peripheral field is increased to 6° by having a moving fixation stimulus. The Pro range operate through the MS Windows environment with the 3500 using an internal PC with an external touch screen while the Pro 5000 was driven entirely by an external PC. In all other ways the two instruments were identical. The Henson Pro range incorporate 6 different test strategies: 1. Multiple-stimulus supra-threshold test for quick screening. The graded approach developed for the CFS 2000 is still to be found in this instrument. 2. Single-stimulus supra-threshold test using the same test locations as the multiple-stimulus version only relying on the patient to press a response key every time they see a stimulus. 3. Full-threshold test using the 4-2dB staircase strategy with two reversals. 4. Fast threshold using a 3dB staircase with a single reversal.
5.
Drivers test with stimuli
corresponding to the Estermann Binocular test which
is now accepted as the standard for
6.
Multisampling strategy21. Each strategy included several different test programs. For example, there are central and peripheral test programs which use the multiple-stimulus supra-threshold strategy and central, peripheral and macular programs which use the threshold strategies. In all there are over 30 different test programs within the instrument.
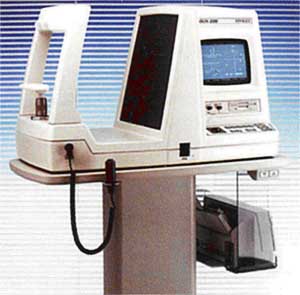
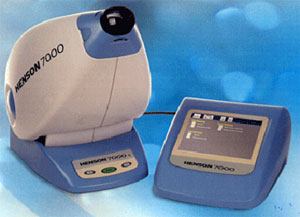
All the programs of the Henson Pro allow the perimetrist to add, delete and re-test individual locations, as per the CFA 4000. The perimetrist simply moves the mouse cursor over the desired location and clicks one of the mouse buttons (on the touch screen version the perimetrist simply touches the screen at the desired location). This facility can be used to quickly check a response, map out the extent of any loss or remove artefacts/errors. Global indices such as mean defect, and standard deviation are re-calculated following the addition or deletion of any data. Speed is an important parameter in any visual field test and there are several ways in which the Henson Pro perimeters speed up the visual field test: 1. There is no need to enter any patient’s details (other than their age) until you opt to save the results. In primary care the majority of patients will not have a visual field defect and practitioners may simply wish to mark on the record card that the field has been checked and that no defect was found. This facility does not restrict the practitioner as they can opt to save every record if they so wish. It merely defers the process of entering patient details until the decision to save the data has been made and, thereby, reduces the amount of time to complete a screening examination. 2. In the supra-threshold tests it can present multiple-stimulus patterns. This reduces the test time by approximately 50 per cent over that of a single-stimulus test. 3. Its programs have been designed to minimise the number of key presses. For example, to start a new examination you simply click the new patient button. 4. Each patient is treated as a single entity. When you select to save or print the visual field results it saves or prints the results from both eyes (it can save or print the data from one eye). So how long does it take the Henson Pro to screen the central field? Published results from independent practitioners give a mean value of 2.5 minutes for both eyes using the supra-threshold multiple-stimulus screening test of the Henson 2000. The Henson Pro uses exactly the same test with a faster computer and a program which requires less key presses. A recent development in the Pro Range is the incorporation of variable response times for the single-stimulus strategies19, 20. The software monitors how quickly a patient presses the response button and adjusts the inter-stimulus interval accordingly. In the single-stimulus supra-threshold mode it also analyses the response times20. At the end of the test it establishes the normal range of response times for the patient and then re-examines those locations where the response time was either abnormally short or abnormally long. This analysis, which takes place so quickly that the patient does not even notice a delay in the series of presentations, removes suspect responses and improves the overall reliability of the data. The Henson Pro uses an established Windows database program to store visual field data. This has several advantages, the notable ones being that the database is well proven and reliable, the sort and find options are fast and efficient, the capacity to hold data is practically unlimited and the file formats are well known and easily read into a wide range of other software packages. With each record the Henson Pro perimeters also store an image of the field chart. This image can be easily accessed by third party electronic patient record systems. Henson Pros can also be networked with patient records being stored on an external file server where data is accessible from any perimeter/computer running the Henson software. Supra-threshold tests can be run on the basis of an age related estimate of the patient’s sensitivity or in a threshold related mode where an estimate of the patient’s sensitivity is derived at the onset of the supra-threshold test20. A new algorithm (HEART) was introduced to improve the accuracy of the threshold estimate at the onset of the supra-threshold test. This algorithm, which replaced one using the 4-2 threshold strategy, gives much more accurate values and reduces the number of false positive responses20. The threshold programs the Henson Pro incorporate a facility to start the test off from prior data. This facility saves time, because the testing of each location starts at an intensity close to the final threshold, by reducing the number of presentations. The threshold programs calculate the widely used global indices mean defect, standard deviation of the defect, fluctuation and corrected standard deviation as well as displaying probability values. The Henson Pro 6000The Henson Pro 6000 was introduced in 2000, see Figure 6. It is smaller than the Henson Pro 3500/5000 and incorporates a built in touch screen. The size reduction is, in part, achieved by reducing the size of the bowl. The radius of the bowl is still 25cm but it does not extend out to the same eccentricity as in the 3500/5000. The programmes are the same as those of the 3500/5000 with the exception that there is a need for more re-fixations when testing the peripheral field. The facilities of being able to add/delete/re-test locations has been retained along with the graded approach to visual field screening within the supra-threshold strategies and the monitoring of response latencies in single-stimulus strategies. The 6000 has an integral CCD camera that relays an image of the patient’s eye to the touch screen display. The CCD cameras field of view increases when performing binocular drivers’ tests so that the perimetrist can see both eyes and can still monitor fixation. The Henson Pro 7000The Henson Pro 7000 was introduced in 2007, see Figure 7. It is a very compact central visual field analyzer (testing out to 24 degrees) that has an external touch screen display and runs the central supra-threshold (multiple and single-stimulus) and threshold tests found in the 3500/5000. Its small size makes it particularly suitable for domiciliary visits and studies where portability is important. The patient looks through a lens at an internal bowl. Stimuli are again LEDs which project light onto the back surface of the bowl as in the Pro 3500/5000. The Pro 7000 does not incorporate a CCD camera. Current modelsThe Henson Pro 5000/6000/7000 are all still in production (June 2007). Further details can be found at: http://www.weco-uk.com/henson_visual_field_analysers/
References
1.
Klein
BEK, Klein R, Sponsel WE et al. Prevalence
of glaucoma. The Beaver Dam study. Ophthalmology 1992;99:1499-1504.
2.
Coffey M, Reidy A, Wormald R et al. Prevalence of glaucoma in the
west of Ireland. Br J Ophthalmol 1992;77:17-21.
3.
Reidy
A, Minassian DC, Vafidis G
et al. Prevalence of serious eye
disease and visual impairment in a noth London
population: population based, cross sectional study. Br Med J 1998;316:1643-1646.
4.
Henson DB
Patterns of stimuli. Optician 1986;191: May 9th
19-29.
5.
Henson DB.
The Henson CFS2000. Contact Lens J 1988:16;272-274.
6.
Henson DB.
An optimized visual field screening method (summary). Surv
Ophtalmol 1989;33:443-444.
7.
Henson DB.
Visual field screening and the development of a new screening program. J Amer Optom Assoc 1989;60:893-897.
8.
Henson DB Optimised visual
field test strategies for the screening and quantification of glaucomatous
defects. Brit J Clin Practice 1987;41:50-55.
9.
Henson DB, Bryson H. Clinical
results with the Henson-Hamblin CFS2000. Doc Ophthalmol
Proc Series 1986;49:233-238.
10.
Chauhan BC, Henson DB. The distribution of visual field scores in a normal
population. Doc Ophthalmol Proc Series 1986;49:109-115.
11.
Sponsel WE, Hobley
AJ, Henson DB, Chauhan BC, Dallas NL. Quantitative
supra-threshold static perimetry; the value of field score and asymmetry
analysis in the early detection of chronic open angle glaucoma. Doc Ophthalmol Proc Series 1986;49:217-229.
12.
Henson DB, Chauhan
BC, Hobley AJ. Screening for glaucomatous visual field
defects: the relationship between sensitivity, specificity and the number of
test locations. Ophthal Physiol Optics 1988;8:123-127.
13.
Chauhan BC, Henson DB, Hobley AJ. Cluster analysis in visual field
quantification. Doc Ophthalmol 1988;69:25-39.
14.
Chauhan BC, Henson DB, Hobley AJ. Cluster
analysis in supra-threshold perimetry. In : Perimetry
Update 1988/89. Ed. A Heijl, Kugler/Ghedini, Amsterdam 1989.
15.
Henson DB, Anderson R. Threshold related supra threshold field
testing: which is the best technique of establishing the threshold? Perimetry
Update 1990/91 pp367-372. Ed. RP Mills, A Heijl, Kugler, Amsterdam 1991.
16.
Henson DB. A look at the new Henson perimeter. Optician
1993;206 No 5410, 17-21.
17.
Henson DB. The design and use
of a new central field analyser. Optician 1995;209
number 3305, 26-28.
18.
Henson DB, Artes PH, Chaudry
SJ, Chauhan BC. Supra-threshold perimetry: establishing
the test level. In: Perimetry Update
1998/1999, pp 243-252. Eds. Wall M, & Wild J. Kugler Publications, Amsterdam 1999.
19.
Artes PH,
McLeod D, Henson DB. Response time as a discriminator
between true- and false-positive responses in supra-threshold perimetry. Invest
Ophthal Vis Sci 2002;43:129-132.
20.
Henson DB, Artes PH. New
developments in supra-threshold perimetry. Ophthal Physiol Opt 2002;22:463-468.
21.
Artes PH, Henson DB, Harper R,
McLeod D. Detection and quantification
of visual field loss: a comparison of perimetric strategies by computer
simulation. Invest Ophthal Vis Sci
2003;44:2582-2587.
22.
Henson DB. Visual Fields 2nd
edition, Oxford University Press, Oxford 2000.
23.
Bebie H, Fankhauser F, Spahr
J. Static perimetry: strategies. Acta Ophthalmol 1976;54:325-338.
24.
Harrington DO. The visual Fields. A textbook and atlas of
clinical perimetry. Mosby, St Louis 1976.
Copyright 2008. Imaging and Perimetry Society |